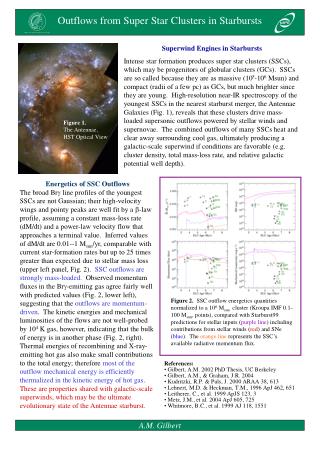
Download
1 / 12
120 likes | 275 Views
Extracting Dynamics of Multiple Indicators for Spatial recognition of Ecoclimatic zones in Circum-Saharan Africa. Didier Leibovici and Gilbert Quillevere Centre for Geospatial Sciences, University of Nottingham, Nottingham UK

E N D
Extracting Dynamics of Multiple Indicators for Spatial recognition of Ecoclimatic zones in Circum-Saharan Africa Didier Leibovici and Gilbert Quillevere Centre for Geospatial Sciences, University of Nottingham, Nottingham UK IRD-US166 Désertification, Maison de la Télédétection, Montpellier France didier.leibovici@nottingham.ac.uk Dr Didier Leibovici
ROSELT network www.roselt-oss.org long term monitoring of desertification representativenessof 30 observatories arid, semi-arid, dry sub-humid circum-Saharan region Biophysical Ecological Socio-economical Spatio-temporal variations Ecoregion delineation homogeneous zones Dr Didier Leibovici
focusing on ecoclimatic variations (physical climatic aspects) arid semi-arid dry sub-humid indicators e.g. aridity index P/ETo ~0.10 ~0.35 ~0.50 (annual) mensual variations !? (see ombrothermal diagrams Le Houérou) WORLDCLIM 1950-2000 www.worldclim.org/current.htm FAO www.fao.org averages over 50 years Dr Didier Leibovici
12 months meaningful correlations among 120 variables ?! 120 indicators 10 indicators PTAk + kmeans tensorial structure kmeans or PCA + kmeans ? analysing interactions 298249 locations 298249 locations space x time x indicators Principal Tensor Analysis on k-modes (k=3) offers a generalisation of PCA clustering the dynamics capturing spatio-temporal variations 12 x 10 values at 298249 pixels (grid 5’’) Dr Didier Leibovici
Principal Tensor Analysis on k-modes (k=3) R add-on package www.r-project.org PTAk PCA 1st principal tensor of a 2-way table, of 3-way table matrix calculus to tensor algebra Dr Didier Leibovici
298249 x 10 x 12 decomposition of Sum of Squares like PCA but a multi-level hierarchy recursive algorithm { { { PCA of 298249 x 10 (63.66%)23.15% 6.95% 3.31% … Dr Didier Leibovici
ssea shore and low relief<>high relief itemperature Tmin, Tave but also Q3 <> altitude Alt mall year more during months 5 to 10 slatitude gradients from Sahara (<>) idrought/extreme conditions ETo, dM, Tmax <> rain related indicators Q3, P, PETo mall year more during months 5 to 10 vs111 39.15% 12vs111 298249 10 14.24% Dr Didier Leibovici
soceanic equatorial <> gradient North-South in Maghreb i (<>) temperature Tmin, Tave, Tmax, and evapotranspiration ETo m6, 7, 8, 9 <> dry months 11, 12, 1, 2 sMaghreb and equatorial <> Sudan-Sahel zone itemperature Tmin, Tave, Tmax, and altitude Alt <> rain and aridity indicators Q3, P, PETo, dM mwet hot months 7, 8, 9 anddry months 12, 1, 2 <> mid seasons months 4, 5, 10 vs333 1.64% Vs222 16.33% Dr Didier Leibovici
sgradiant N&S Sudan-Sahel zone<> northMaghreb and equatorial irain related indicators Q3, P, PETo, dM (<>) m6, 7, 8, 9 <> dry months 11, 12, 1, 2 12vs222 298249 10 3.53% snorth Maghreb and Guinea area(<>) i(<>) temperature Tmin, Tave, Tmax,evapotranspiration ETo mend of dry months 3, 4, 5 <> 7, 8 10 vs222 298249 12 0.84% Dr Didier Leibovici
kmeans clustering of selected (s) in 15 classes shapefile on Catalogue Service Webmdweb.roselt-oss.org • ecoclimatic pattern • ROSELT covers all the classes in arid, semi arid, sub humid zones • observatories mainly of one class (but 1/3 of 2 calsses: 80% area in 1 class) • 0.08dd is between 9km and 7.5km classes proximity from hierarchical clustering Dr Didier Leibovici
period months months indicators indicators locations locations Some drawbacks • resolution (1’) relatively to observatory size (~20 pixels … ) • 50 years average (WORLDCLIM) … periods • number of classes • only ecoclimatic delineation Some solutions • better resolutions available • introducing periods (within the 50 years) and performing a PTA4 • space x months x period x indicators • multilevel classification (cutting the tree) : • e.g. kmeans with 40 +hierachical tree of them • intercepting classes from same methodology on different domains • ecolimatic soil-vegetation socio-economic • or using all indicators together (allowing correlation between domains) Dr Didier Leibovici
months indicators locations Extracting Dynamics of Multiple Indicators for Spatial recognition of Ecoclimatic zones in Circum-Saharan Africa Didier Leibovici and Gilbert Quillevere Centre for Geospatial Sciences, University of Nottingham, Nottingham UK IRD-US166 Désertification, Maison de la Télédétection, Montpellier France Merci – Questions? didier.leibovici@nottingham.ac.uk Dr Didier Leibovici