Download
1 / 26
260 likes | 465 Views
Monitoring Bio-Optical Processes Using NPP-VIIRS And MODIS-Aqua Ocean Color Products. Robert Arnone (1) , Sherwin Ladner (2) , Giulietta Fargion (3) , Paul Martinolich (4) , Ryan Vandermeulen (1) , Jennifer Bowers (3) , Adam Lawson (2)

E N D
Monitoring Bio-Optical Processes Using NPP-VIIRS And MODIS-Aqua Ocean Color Products Robert Arnone(1), Sherwin Ladner(2), Giulietta Fargion(3), Paul Martinolich (4), Ryan Vandermeulen (1), Jennifer Bowers(3), Adam Lawson(2) 1 University of Southern Mississippi, Stennis Space Center, MS. 2 Naval Reserach laboratory, Stennis Space Center MS. 3 San Diego State University, San Diego, CA. 4 QinetiQ Corp, Stennis Space Center, MS.
Monitoring ocean Processes Uncertainty in Ocean products Objective – How rapidly do bio-optical processes change and “Can they be detected using ocean color? “ How do these “ color” changes affect Calibration and Validation Procedures? --------------------------------------------------- Evaluate changes from satellite retrieved bio-optical products Assess sensor and processing characteristics that impact hourly changes Assess the satellite retrieved products uncertainty . Arnone_ SPIE- Baltimore 2013
Ocean Color products Uncertainty • MODIS – VIIRS - Short term variability – (Hours) • Assumption is satellite is looking at Same ocean color water .. • Uncertainty associated with Inter-comparison of sensors (MODIS / VIIRS) What must we consider in evaluating time change of bio-optical processes ? 1) Water mass advection and physical processes 2) Ocean Color Changes from bio-optical changes - Biological Changes - Growth / decay -- also vertical movement of bio-optical layers , and particle resuspension, 3) Sensor characterization and processing Calibration, angular affects , i.e. Atmospheric correction (Rayleigh, Aerosols ) - BRDF, etc Half Angle Mirror (HAM) left and right side. • Optimum “tracking” is to use the “same” sensor, for assessing changes. Such as - Geostationary Satellite (example – GOCI) Arnone_ SPIE- Baltimore 2013
Approach- - Sequential orbits from MODIS and S-NPP – VIIRS S-NPP Left Side of Scan 18: 15 S-NPP Right Side of Scan 19:56 -70 56 42 28 14 MODIS – Aqua 18:45 Sensor Zenith degrees 70 35 0 35 70 S-NPP - Daily Orbital Overlap at ~ 30 degree latitude ~ 700 pixel Overlap - Very Similar Solar Zenith ~ 40 degrees. 3 Overlapping ocean Color Products with 110 minutes ! 0 800 1600 2400 3200 Pixel Arnone_ SPIE- Baltimore 2013
Methods -- Nov1, 2012 1. Processed using L2gen: 2. Examine the normalized water leaving radiance “nLw445” and “ nLw555” and Chlorophyll (OC2) ratio (445/555) (488/555) S- NPP 306.1101.181524 S- Npp 306.1101.195623 19:56 GMT 18:15 GMT MODIS 306 18: 45 GMT Arnone_ SPIE- Baltimore 2013
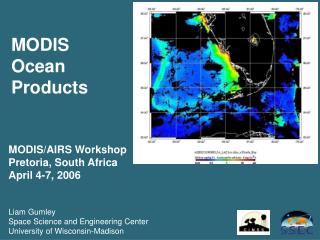
18:15 - NPP Line 1- Plumes Line 2 – WavCis 19:56 –NPP 18:45 – MODIS WavCis -90 29’ 28 52’ Transect #2- - Wide range of water “type” Open and Coastal - East West Angle dependence - Transect through Aeronet – SeaPrism Site • Cloud Development • And formation Arnone_ SPIE- Baltimore 2013
WaveCis cloud South Pass nLw 443 1956 18:15 - NPP Line 1- Plumes Line 2 – WavCis 19:56 –NPP 18:45 – MODIS Arnone_ SPIE- Baltimore 2013
WaveCis cloud South Pass nLw 443 18:15 - NPP Line 1- Plumes Line 2 – WavCis 19:56 –NPP 18:45 – MODIS NPP 19:55 Eastern Side NPP 18:15 Western Side Wavcis -90 29’ 28 52’ Line 4 Offshore 55 Aqua 18:45 Arnone_ SPIE- Baltimore 2013
Along Line 2 transect - NPP and MODIS variations of radiance with 110 minutes Aeronet 19:55 78 68 48 28 Constant SeaPrism Values • 58 • 38 18:15 18:45 Sensor Zenith Angle variations Arnone_ SPIE- Baltimore 2013
Variation along the Transect 18:15 and 19:55 NPP- Orbits What differences within 110 minutes affect “Open and coastal waters “ - - High scatter at 443 - 19:55 Bias Higher Low scatter at 551 How channels impacts Chlorophyll Product? 1:1 1:1 Arnone_ SPIE- Baltimore 2013
NPP Chlorophyll variation with 110 minutes along transect Note linear Chlorophyll scale . 18:15 orbit – lower chlorophyll at high concentrations / 1:1 This results address the “Product Uncertainty” with 110 minutes with same sensor. Differences results from a) Biological Processes, b) water mass advection or c) Sensor processing Arnone_ SPIE- Baltimore 2013
Impact of Sensor Zenith Angle of ocean color retrievals NPP 18:15 – 1955 difference along the Transect Line nLw 555 Aeronet Uncertainty alone the Transect D nLw uW/cm2/nm D nLw 18:15- 1955 Arnone_ SPIE- Baltimore 2013
Impact of Sensor Zenith Angle of ocean color retrievals NPP 18:15 – 1955 difference along the Transect Line nLw 445 Uncertainty alone the Transect Aeronet D nLw 18:15- 1955 Arnone_ SPIE- Baltimore 2013
Impact of Sensor Zenith Angle of ocean color retrievals NPP 18:15 – 1955 difference along the Transect Line 19:55 110 minute Chlorophyll Bloom ? Arnone_ SPIE- Baltimore 2013
Stability of the Chlorophyll Response along the Transect UNCERTAINTY along the transect Stable Stable Positive Increase 18:15 - NPP Stable 19:56 –NPP Stable Gradients -92 -91 -90 -89 -88 Gradients Arnone_ SPIE- Baltimore 2013
Evaluation of the Atmosphere Correction on sequential NPP products NPP 18:15 – 1955 difference along the Transect Line Lt(l) = Lr(l) + La(l) + Lu(l) La 865 used for determining Aerosol Model and Epsilon (spectral La(l) ) Which Aerosol Model pair were selected ? Arnone_ SPIE- Baltimore 2013
Evaluation of the Atmosphere Correction on sequential retrievals NPP 18:15 – 1955 difference along the Transect Line b) Lt(l) = Lr(l) + La(l) + Lu(l) La 865 used for determining Aerosol Model and Epsilon (spectral La(l) • Aerosol model pair used • NPP 18:15 used 35-36, 34 – 35 ) , • MODIS used 35- 36. • NPP 19: 56 used 32-33 and 33-34 • All Aerosol Models Very Similar • Across transect !! Arnone_ SPIE- Baltimore 2013
Changes in ocean color products over short time scales Examples of changes in short scale chlorophyll retrievals from MODIS and NPP Arnone_ SPIE- Baltimore 2013
Changes in ocean color products over short time scales 121 – Minutes 20: 16 NPP 21: 22 MODIS 22:27 NPP Southern California Current June 25 , 2012 22:27 NPP 20: 16 NPP 21: 22 MODIS Arnone_ SPIE- Baltimore 2013
Changes in Satellite retrievals Chlorophyll with 121 minutes Monterey Bay A B 20: 16 S- NPP Arnone_ SPIE- Baltimore 2013 21: 22 MODIS 22:27 S- NPP
20: 16 S- NPP 21: 22 MODIS 22:27 S- NPP A A C C Monterey Bay B B Southern California Chlorophyll Sequence within 111 minutes derived from S-NPP and MODIS from June 25, 2012 from 20:16 – 22:27 GMT . - Possible bio-optical changes from upwelling and advective changes along the coasts. Arnone_ SPIE- Baltimore 2013
Sequential NPP Orbits 101 Minutes 17:37 GMT 19:18 17:37 Gulf Stream Florida Coast 19:18 Florida Arnone_ SPIE- Baltimore 2013
A. Over lap of S-NPP orbits Chlorophyll Gulf Stream A A B B 19:18 17:37 C B. C Movement of Chlorophyll along the North Wall Shingles November 3, 2012, NPP Chlorophyll products along the North Wall of the Gulf Stream off of Florida from 17:37 and 19:18 GMT 17:37 Arnone_ SPIE- Baltimore 2013
SUMMARY: Monitoring Bio-Optical Processes Using NPP-VIIRS And MODIS- Aqua Ocean Color Products • 1) Sequential Orbits of NPP and MODIS within the same day were used to evaluate • Ocean Color Products for monitoring changes in bio-optical processes. • 2) Explored variability of bio-optical products within approximately 100 minutes • 3) Evaluated capability of ocean color to monitor short scales bio-optical processes. • Examined : • 1. Water mass advection and bio-optical processes • 2. Examined uncertainty possibly resulting from sensor characteristics and • ocean color processing . • Demonstrated sequential satellite orbits can establish the satellite products uncertainty for calibration / validation. • Demonstrated ocean color capability to characterize the bio-optical processes by using overlapping orbits and multiple satellites. Arnone_ SPIE- Baltimore 2013 SPIE – Baltimore 2013
Questions? Acknowledgements: Thanks is given to the NOAA JPSS program for funding support Arnone_ SPIE- Baltimore 2013
Diff 1815-1955 Ratio 1815/1955 Per Chg (1815-1955) 1955