Download
1 / 25
250 likes | 422 Views
Web-based Low Impact Development Decision Support and Planning Tools. Bernie Engel Larry Theller Youn Shik Park Purdue University GLRI Project Corps of Engineers 516(e ) Program. May 17-18, 2011. L-THIA Model. Long-Term Hydrologic Impact Assessment Average annual runoff

E N D
Web-based Low Impact Development Decision Support and Planning Tools Bernie Engel Larry Theller YounShik Park Purdue University GLRI Project Corps of Engineers 516(e) Program. May 17-18, 2011
L-THIA Model Long-Term Hydrologic Impact Assessment Average annual runoff NPS pollution An overview / screening model User friendly tool Does not require detailed data input Identifies need for more detailed modeling Provides "What-If" alternatives evaluation scenarios
Purdue University is an Equal Opportunity/Equal Access institution.
The new version will populate the L-THIA LID spreadsheet from the map. Currently this is manual.
Desktop Input and Options User sees online gage’s rainfall total in a popup. User enters landuse type and area and soil OR restores from saved run. User may elect which curve number and EMC file be used. These parameter files are text files and may be user-edited. EMCs are automatically populated to match landuse.
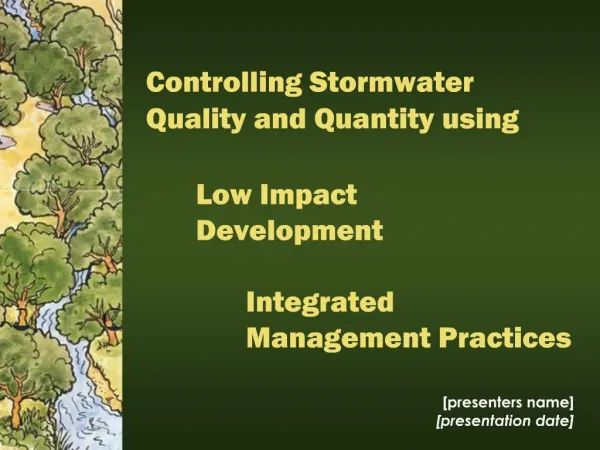
Low-Impact Development (LID) An approach to land development to mimic the pre-development site hydrology to: • Reduce volume of runoff • Decentralize runoff, diffusing flows into smaller retention/detention areas • Improve water quality • Encourage groundwater infiltration
Minimization Reduce imperviousness Soil Compaction LID Major Components 1. Conservation (Watershed and Site Level) 2. Minimization (Watershed and Site Level) 3. Integrated Management Practices (Site Level) • Conservation • Forest/Woods • Infiltrable Soils • Storage, Detention & Filtration • Rain gardens • Drainage swales • Green roofs • Porous Pavement https://engineering.purdue.edu/mapserve/LTHIA7/lthianew/lidIntro.htm
L-THIA LID Basic Tool Application: Target preliminary goals at the watershed and site level • Reduce imperviousness • Conserve infiltratable soils • Conserve functional / sensitive landscape • Minimize land disturbances • Anticipate need for other LID practices to reduce NPS and stormwater volume
Enhanced features in L-THIA-LID • Forty (40) land uses. TR-55 CN values. • Modified values for runoff CN to characterize hydrologic and water quality impacts of LID practices (Sample et al., 2001). • Distributed CN approach for runoff computation. • Estimation of baseflow from direct runoff using reverse digital filter method. • Computation of 95th percentile rainfall event and associated runoff. • Computation of average daily concentrations of pollutants in runoff (TSS, TP, TN, Pb, Cu, Zn, E-coli) • Currently L-THIA-LID supports simulations of bioretention , grass swales, rain barrels and cisterns, open wooded space, green roofs, porous pavement and permeable patios.
Baseflow estimation in the improved L-THIA-LID Model • Baseflow occurs at a threshold • Determination of threshold by delineating the tip of 1500 headwater streams in Indiana using 2008 NHD flow lines • Average of areas contributing water to headwater streams is the threshold. • Threshold is 82 acres or 0.33 km2
Map or HUC Delineate area of Interest LDC & LOADEST Calculate Estimated Load EDIT L-THIA Scenario Set Goals Model BMP change against L-THIA outputs Run L-THIA Under Construction
Load Duration Tool with LOADEST https://engineering.purdue.edu/~ldc/LU/wi.html
a b 1. Select State (a).(Indiana and Wisconsin are available, so far.) 2. Three ways to find USGS gauging station : Type address or ZIP (b), Through Google Maps interface (c), Type Station Number (d). c d
Station was found by address, “FOX RIVER AT BERLIN, WI” Click this button to derive Flowand Water Quality data.
Select period to develop LDC (d), and click this button. (period : Jan/1/2008 – Nov/8/2010, WQ : 00530) a The tool gives.. .. Information of pre-selected 24 WQ data (a), .. Information on Flow data (b), .. Raw data file of flow and WQ data (c). b c d
a b A simple module works to combine flow and WQ data. Set Water Quality Standard (a). Also combined data file is downloadable to use in other models (b).
FDC a LDC Time Series Plot b LOADEST can be run with backgroundmode on this page (a). It provides Mean Daily Load estimated by USGS data (b). Concentration Plot
Changed by LOADEST result During processing, the figures on the page will be replaced by LOADEST results. LOADEST Inputs and Outputs are downloadable (a). a
Changed by LOADEST result During processing, the figures will be replaced by LOADEST result. Estimated Annual Load File is downloadable(a). Mean Daily Load by LOADEST result will be displayed (b). a b
LOADEST results, Estimated Mean Daily Load compared to Mean Daily Load from observed data. Purdue University is an Equal Opportunity/Equal Access institution.
The new step beyond L-THIA is a tool to determine how much landuse change is needed to reduce pollutant to a goal, or how much EMC or runoff must drop to meet that goal.
The tool requires… .. area of the combination of landuse and soil group, .. daily precipitation data, .. objectives (chemistry) to reduce, .. reduction goal. The goal of this tool is to determine how much landuse change or EMC reduction is needed to reduce pollutant to a goal. The tool operates with a Genetic-Algorithm.
Client Side Server Side Input areaof each HRU Changeable CN and EMC manually Upload daily precipitation data Set objective to reduce Set the goal Modify CN or EMC, If requested Define optimum area to meet the goal by Genetic-Algorithm Suggested area to meet the goal (table) Comparison of Scenarios (graph) Downloadable daily and annual file Objectives: Runoff, Total Suspended Solids, Total Phosphorus, Total Nitrogen, Lead, Copper, Zinc, E-coli.
The tool provides… .. How much area needs to change to meet the goal, .. annual estimated NPS load values for ‘current’ and ‘changed’, .. annual and daily as output file.