1 / 0

presented by Harry S. Dent, Jr.

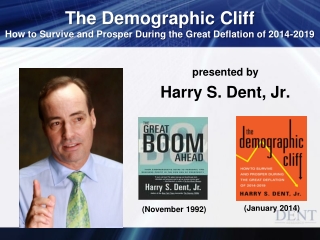
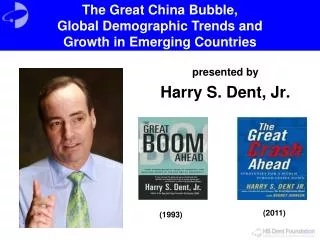
presented by Harry S. Dent, Jr. . Update on Bubbles Around the World. (2011). (1993). U.S. Debt as a Percent of GDP 1870-2011. Source: Courtesy of Hoisington Investment Management. Velocity of Money 1900-2011. Source: Courtesy of Hoisington Investment Management.

orsin
Download Presentation

presented by Harry S. Dent, Jr.

An Image/Link below is provided (as is) to download presentation Download Policy: Content on the Website is provided to you AS IS for your information and personal use and may not be sold / licensed / shared on other websites without getting consent from its author. Content is provided to you AS IS for your information and personal use only. Download presentation by click this link. While downloading, if for some reason you are not able to download a presentation, the publisher may have deleted the file from their server. During download, if you can't get a presentation, the file might be deleted by the publisher.

E N D

Presentation Transcript


  1. presented by Harry S. Dent, Jr. Update on Bubbles Around the World (2011) (1993)
  2. U.S. Debt as a Percent of GDP1870-2011 Source: Courtesy of Hoisington Investment Management
  3. Velocity of Money1900-2011 Source: Courtesy of Hoisington Investment Management
  4. Cities with the Greatest Bubbles, 2000 to Peak Data Source: National Statistics Bureaus, ECB, S&P/Case-Shiller, HS Dent, 2012
  5. Shanghai Real Estate Prices 1999-2012 Index= 2003 Data Source: Global Property Guide, 2012
  6. Real Estate Prices, Mumbai 2000-2012 Index= 2007 Data Source: National Housing Bank, Bank of India, 2012
  7. Real Estate PricesLondon, England, 1995-2012 Index= 2000 Data Source: UK Land Registry, 2012
  8. Real Estate PricesMiami, Florida, US, 1989-2012 Data Source: Case-Shiller, 2012
  9. Real Estate PricesLos Angeles, CA, US, 1989-2012 Index= 2000 Data Source: Case-Shiller, 2012
  10. Real Estate PricesSydney, Australia,1986-2012 Data Source: Australia Bureau of Statistics, 2012
  11. Real Estate PricesVancouver, Canada 1990-2012 Index= 2005 Data Source: Teranet, National Bank of Canada; 2012
  12. Real Estate PricesNew York City, NY, US 1989-2012 Index= 2000 Data Source: Case-Shiller, 2012
  13. Real Estate PricesPhoenix, AZ, US 1989-2012 Index= 2000 Data Source: Case-Shiller, 2012
  14. S&P 500 Megaphone Pattern1960-1975 E C A B D Data Source: Yahoo! Finance, 2012
  15. S&P 500 Megaphone Pattern1995-2015 E C A B D Data Source: Yahoo! Finance, 2012
  16. Dow Megaphone Pattern1995-2015 E C A B D Data Source: Yahoo! Finance, 2012
  17. Russell 2000 Megaphone Pattern1995-2015 E C A D B Data Source: Yahoo! Finance, 2012
  18. Australia, ASX 200 Head-and-Shoulders Pattern, 1995-2015 H S S Data Source: Bloomberg, 2012
  19. Spain, IBEX 35, Head and Shoulders Pattern,1995-2015 H Logarithmic Scale S S Data Source: Bloomberg, 2012
  20. Germany, DAX Channel Pattern,1995-2015 E C A D B Data Source: Yahoo! Finance, 2012
  21. Great Britain, FTSE Channel Pattern, 1995-2015 A C E D B Data Source: Yahoo! Finance, 2012
  22. United States, Nasdaq 5th Wave Peak and A-B-C Correction, 1995-2015 5 B c a a b A Data Source: Yahoo! Finance, 2012
  23. Canada, TSX 5th Wave Peak and A-B-C Correction, 1995-2015 5 B 2 3 1 A 3 4 Data Source: Yahoo! Finance, 2012
  24. Euro Stoxx 50 5th Wave Peak and A-B-C Correction, 1995-2015 5 B 2 A 1 3 Data Source: Bloomberg, 2012
  25. Japan, Nikkei 225 5th Wave Peak and A-B-C Correction, 1995-2015 5 b B a b c a c A C Data Source: Yahoo! Finance, 2012
  26. Shanghai Composite - China5th Wave Peak and A-B-C Correction, 1995-2015 5 B 2 3 1 A 3 4 Data Source: Bloomberg, 2012
  27. India, Sensex 5th Wave Peak and A-B-C Correction, 1995-2015 5 B A C Data Source: Bloomberg, 2012
  28. Brazil, BM&F BOVESPA 5th Wave Peak and A-B-C Correction, 1995-2015 5 B 2 1 A 3 Data Source: Yahoo! Finance, 2012
  29. Emerging Markets (EEM) 5th Wave Peak and A-B-C Correction, 1995-2015 5 B 2 1 A 3 Data Source: Yahoo! Finance, 2012
  30. China’s Global Share of Selected Commodities Percent Source: The Economist; “A Game of Catch-up,” 9/24/2011
  31. 29-30 Year Commodity Price CycleCRB Index (PPI before 1947) 1913-2040 2039-40 2009-10 1980 1949-1951 1920 Data Source: Bloomberg, 2012
  32. CRB Commodity Index1995-2015 5 B 2 1 A 3 Data Source: Bloomberg, 2012
  33. Gold1995-2015 or 5 5 3 4 A 1 2 Data Source: Bloomberg, 2012
  34. Silver1995-2015 5 B 2 A 1 3 1 4 3 2 Data Source: Bloomberg, 2012
  35. Oil1995-2015 5 B 3 1 4 A 2 C? Data Source: Bloomberg, 2012
  36. Natural Gas1995-2015 Data Source: Bloomberg, 2012
  37. Copper1995-2015 5 3 B A 1 4 C? 2 Data Source: Bloomberg, 2012
  38. Corn1995-2015 Data Source: Bloomberg, 2012
  39. 10-Year Treasury Bond Channel1989-2015 Data Source: Yahoo! Finance, 2012
  40. Treasury Bond Prices2002-2012 5 B 3 A 1 C 4 2 Data Source: Bloomberg, 2012
  41. High Yield Corporate Bond Index, 1998-2012 5 3 4 A Data Source: Bloomberg, 2012
  42. S&P 500 vs. ECRI Index2008-2012 Source: ProtectMyRetirementAccount.com, Weekly Market Update, 10/19/2012
  43. S&P Index vs. NYSE Advance/Decline Volume Line Source: ProtectMyRetirementAccount.com, Weekly Market Update, 9/7/2012
  44. Divergence: Buying Power
  45. Divergence: Dow Industrials vs. Dow Transports, 2009-2012 Index 100=2009 Data Source: Bloomberg, 2012
  46. Divergence: S&P 500 vs. Euro 502009-2012 Index 100=2009 Data Source: Bloomberg, 2012
  47. Divergence: Shanghai Composite vs. CRB, 2009-2012 Index 100=2009 Data Source: Bloomberg, 2012
  48. Divergence: Gold vs. CRB2009-2012 Data Source: Bloomberg, 2012
  49. Top 10%, 1% and of Income Shares in U.S. Incl. Capital Gains, 1913-2010 $246,934 $1,019,089 Data Source: Alvaredo, Facundo, Anthony B. Atkinson, Thomas Piketty and Emmanuel Saez, The World Top Incomes Database, http://g-mond.parisschoolofeconomics.eu/topincomes, 10/29/2012
  50. Key Economic Indicator #2Daily Growth Index, Sept. 2008- Oct. 2012 Source: Consumer Metrics, 2012
More Related