Download
1 / 1
10 likes | 151 Views
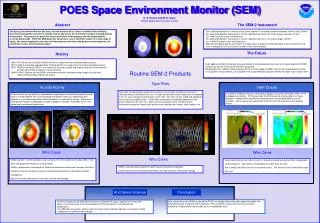
POES Space Environment Monitor (SEM). D. S. Evans and M. S. Greer NOAA Space Environment Center. Abstract. The SEM-2 Instrument. - Four solid-state detectors to monitor solar proton events in four energy channels between 16 MeV and 275 MeV

E N D
POES Space Environment Monitor (SEM) D. S. Evans and M. S. Greer NOAA Space Environment Center Abstract The SEM-2 Instrument - Four solid-state detectors to monitor solar proton events in four energy channels between 16 MeV and 275 MeV - Two solid-state detector telescopes to monitor radiation belt electrons in three energy channels, 30 keV to >1 MeV at each of two look directions - Two solid-state detector telescopes to monitor radiation belt ions in six energy ranges, 30 keV to > 6.9 MeV at each of two look directions - Eight electrostatic analyzers to monitor the energy fluxes and spectral characteristics of auroral electrons and ions of energies 50 eV to 20,000 eV at each of two look directions The Space Environment Monitor has been, and will continue to be, flown on NOAA’s Polar Orbiting Environmental Satellites in order to monitor various aspects of the near-Earth energetic charged particle environment. This poster sets down the history and future of the program and the measurements currently being made. While the SEM data have found much use in scientific studies of a wide range of topics, this poster emphasizes the near real-time products routinely used by government agencies, the commercial sector, and the general public. The Future History - Eight additional SEM-2 instruments are contracted for and scheduled to be flown on all remaining NOAA POES missions as well as the European METOP spacecraft - Requirements for radiation measurements similar to those made by SEM-2, as well as a comprehensive suite of ionospheric measurements, are included in the future NPOESS program with the first flight to be in about 2010 - 1966 ITOS carries the first Solar Particle Monitor to support the manned space flight program - 1972 NOAA 2-5 included upgraded Solar Particle Monitors to support the manned space flight program - 1978 TIROS-N carries the SEM-1 to monitor both the solar particle and radiation belt environment and to provide a quantitative measure of auroral activity - 1998 NOAA-15 carries the first SEM-2 instrument suite with extended energy ranges for solar and radiation belt particles and auroral activity Routine SEM-2 Products Tiger Plots Auroral Activity HAP Charts Tiger plots are designed to quickly show whether the energetic particle environment is unusually intense and where that is so. As data arrives each sensor response is compared to its one-year average at each location in the orbit. The ratio is color-coded and plotted as a point along the satellite track. A ‘belt index’ estimates the integrated departure of the sensor response from the norm. Below are two examples of the >10 MeV proton environment during an intense solar particle event and during a recent, much weaker one. Ionospheric Prediction Service of Australia produces Hourly Area Prediction (HAP) of HF propagation conditions. IPS incorporates the POES auroral activity patterns in these displays to indicate when and where communications may be degraded by auroral ionization. Shown below are recent HAP charts for both the Australian and Canadian sectors. As data arrives auroral activity is estimated by computing an estimated hemispheric power input to the atmosphere from auroral particle precipitation and cross-referencing that estimate to a corresponding global statistical pattern for that level of activity. That pattern, oriented with respect to geography is made available on the web. Examples from a very active and a more recent period are: Who Cares Who Cares Who Cares - General public, 10,000 accesses a day normally, 100,000 on high activity days (55% of all SEC web page file transfers on June 8, 2000) - Military, government, commercial for situational awareness and system anomaly resolution - Vendors using the the data as input to ionospheric specification and forecast products - Educational - About 100 other web sites link to the SEC auroral activity page - Airservices Australia (air traffic control) for situational awareness during times of degraded communications. The red line is the Melbourne-Cape Town air route - Nav Canada (air traffic control) for the same reason. The red line is the Ottawa-Anchorage air route - NASA’s manned space program for planning and situational awareness - Satellite operators for situational awareness, anomaly resolution, and system design And Some Science Conclusion Data obtained from the SEM’s on-board the POES are finding wide and varied used by the public, the commercial world, and government agencies. Plans currently in place will insure the continued availability of these environmental data for the foreseeable future. - Some 100 papers using SEM data have been published with topics ranging from ring current decay to auroral physics to chemical response of the atmosphere to charge particle precipitation. - The SEM data have been used to create the improved low altitude radiation environment models necessary for satellite systems design.