Download
1 / 27
270 likes | 452 Views
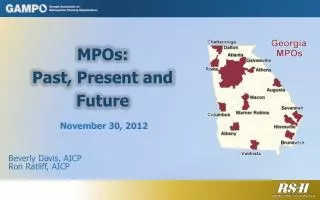
MPOs: Past, Present and Future. November 30, 2012. Beverly Davis, AICP Ron Ratliff, AICP. Transportation: 1900 to 2012. 20 th Century Transportation . 1900 – 1920s Population migration to urban areas for better economic opportunities

E N D
MPOs:Past, Present and Future November 30, 2012 Beverly Davis, AICP Ron Ratliff, AICP
20th Century Transportation • 1900 – 1920s • Population migration to urban areas for better economic opportunities • Growth in urban mass transit – electric railways/streetcar • Primarily operated by electric utility companies • 1917: • Over 1,000 private streetcar companies • 1920s began the move to motor coaches
20th Century Transportation • 1920s to 1930s • First federal highway system designated • US Department of Commerce: Bureau of Public Roads (BPR) to lead the program • Continuing increase in traffic resulted in the development of technical guidance and documents • Manual of Uniform Traffic Control Devices • AASHTO “Green Book” • Highway Capacity Manual
20th Century Transportation • 1930s to 1940s • 1934: First dedicated source of federal funding for non-construction • One and a half percent of annual federal highway funding • Planning surveys, mapping, engineering studies, required to be completed cooperatively between states and BPR • 1944: Expanded federal program • Established primary and secondary systems and urban extensions • Federal funding levels at 45%, 30% and 25% • BPR recognized the need for specific urban planning • Advanced development of transportation study techniques
20th Century Transportation Data Collection Forecasts Goal Formulation Network Identification Alternatives Testing Evaluation and Recommendations • 1950s • Creation of the National System of Interstate and Defense Highways (1956) • Some MPO-like organizations created in major metro areas • Shifting emphasis on addressing urban mobility needs • Development of new techniques • Gravity model • 6-step planning process
20th Century Transportation Economic Factors Social and Community Values Population Land Use Travel Patterns Financial Resources Intermodal Facilities Traffic Control Transportation Facilities • 1960s • 1962 Federal Aid Highway Act required urban transportation planning as a condition of federal funding • 1964: Creation of the Urban Mass Transit Administration (UMTA) to provide financial assistance and technical guidance • 1965 - 1966 • 224 urbanized areas • Required the creation of MPOs • Established the 3-C process and identified planning factors • Created USDOT
20th Century Transportation • 1960s • Major focus on safety • 1968: Traffic Operations Program to Improve Capacity and Safety (TOPICS) • Maximize Capacity • Address Congestion • Enhance Safety • Public involvement requirement • Consistency • Plans • Partners
20th Century Transportation • 1970s • Dedicated funding • Transportation planning • UMTA projects • UMTA and FHWA issued joint regulations • Guidance for urban planning efforts • Required Long Range Plan • NEPA, Clean Air Act, Clean Water Act • Transportation legislation • Increased local planning flexibility • Focused on energy conservation and environmental protection • HPMS
20th Century Transportation • 1980s • Move to decentralize transportation from the federal level to state and local level • Dedicated funding source from increased user fees of five cents per gallon • Focused on the completion of the Interstate system • Maintenance
20th Century Transportation • 1990s • ISTEA • Renaissance for MPOs • Implemented a fiscal constraint requirement in plans • Address land use, multimodal and intermodal connectivity • Required long range planning for states • Created Federal Transit Administration • TEA-21 • Revised/updated the required planning factors • Promoted rebuilding of infrastructure with record funding levels • Expanded focus on multimodal and intermodal elements
20th Century Transportation • SAFETEA-LU • Expanded programs for safety, congestion reduction, freight movement and intermodal connectivity • Innovative funding programs • MAP-21 • Maintains current funding levels for two years • Restructuring of seven core and 13 formula programs into five core programs • Emphasis on freight movements and performance measures
20th Century Transportation 1900 MAP 21 1960 1990 • Transportation Planning Evolution • Began as a federally focused process • Emphasis on highway connections and statewide transportation • Beginning in 1960s a move toward focus on MPOs • Over the decades MPOs have become more and more important • Today, MPOs are planning partners with State and Federal agencies
Performance Measures • MPO Planning Performance Measures • Identify the cost benefit/return on investment • FHWA Guidance • Specific, Measurable, Agreed, Realistic, & Time-bound • Drivers for MPOs • Data availability • Resources • Case Study: Mecklenburg-Union MPO (Charlotte, NC)
Performance Measures • INRIX • Many State DOTs acquiring the data • Traffic data collected anonymously through GPS • Speed data • Data collected daily on major facilities • Used to develop speed profile • Combined with traffic volume data to identify levels and patterns of congestion • Includes freight specific information for 2011
Urban Mobility Report • Prepared by Texas Transportation Institute • 2010 data released - September, 2011 • Second year with Inrix data • 439 U.S. urban areas • 101 Cities • Very Large; Large; Medium and Small
Urban Mobility Report • Key Findings • Yearly Delay per Auto Commuter (hours) • Delay / number of commuters in private automobiles • TTI • Travel time during peak / travel time during off peak
Inrix Summary • Inrix Travel Time Data • Peak period: 6 hours • 6:30 AM – 9:30 AM; 3:30 PM – 6:30 PM • Off Peak: 7 hours • 10:00 AM–11:00 AM; 1:00 PM–3:00 PM; and 7:00 PM–11:00 PM • 1.0 – 1.19: Facilities with No/Minimal Congestion • 1.2 – 1.49: Facilities with Heavy Congestion • >=1.5: Facilities with Adverse Congestion
Charlotte Case Study • Application • Congestion Management Process • I-277 Loop Study • Possible Application • LRTP Project Prioritization Process
Discussion/Questions • Ron Ratliff, AICP Beverly Davis, AICP Ron.ratliff@rsandh.combeverly.davis@rsandh.com