Download
1 / 38
380 likes | 548 Views
FlowScan A Network Traffic Reporting and Visualization Tool. Dave Plonka plonka@doit.wisc.edu. Presentation Overview. Introduction FlowScan's Functionality Hardware & Software Components Sample Graphs Short & Long Term Analyses, Events Graphs by Autonomous Systems, Top ASNs

E N D
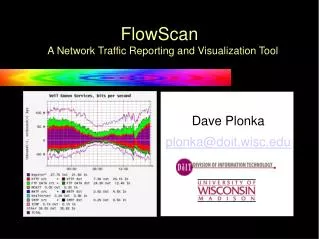
FlowScanA Network Traffic Reporting and Visualization Tool Dave Plonka plonka@doit.wisc.edu
Presentation Overview • Introduction • FlowScan's Functionality • Hardware & Software Components • Sample Graphs • Short & Long Term Analyses, Events • Graphs by Autonomous Systems, Top ASNs • SubNetIO graphs • References
FlowScanA Network Traffic Reporting and Visualization Tool • FlowScan is a software package for open systems that is freely available under the terms of the GNU General Public License. • FlowScan analyzes and reports on flow data exported by Internet Protocol routers. • FlowScan produces graph images which provide a continuous, near real-time view of the network traffic across a network's border. • Development since December 1998. Beta release in September 1999. Released March 2000.
Background on Flows & Cisco NetFlow • The notion of flow profiling was introduced by the research community • Today, for performance and accounting reasons, flow profiling is built into some networking devices • Not yet standards-based • FlowScan utilizes flows defined and exported by Cisco's NetFlow feature. Essentially using the definition introduced by [ClaffyPB]. • By this definition, an IP flow is a unidirectional series of IP packets of a given protocol, traveling between a source and destination, within a certain period of time.
Background on Flows & Cisco NetFlow • Diagram by Daniel W. McRobb, from the cflowd configuration documentation, 1998-1999.
FlowScan'sFunctionality • FlowScan examines each flow and maintains counters based upon that flow's classification • FlowScan periodically reports what it finds into databases. Each database contains packet, byte, and flow counters • Counters are maintained based on these flow attributes: • IP protocol such as ICMP, TCP, and UDP • well-known service or application such as ftp-data, ftp, smtp, nntp, http, RealMedia, Quake, and Napster • the class A, B, C network, or CIDR block in which a "local" IP address resides • the AS (Autonomous System) pair between which the represented traffic was exchanged
FlowScan HardwareComponents • Works with most Cisco routers • Compatibility with Juniper's routers and RiverStone's Switch Router (formerly Cabletron's SSR) is being developed • Most FlowScan systems are Sun SPARC Solaris machines or Intel GNU/Linux or BSD machines • The fastest FlowScan machines appear to be multi-processor Intel PIII machines • GIF or PNG image files suitable for any web server, we use Apache
Flowscan script CampusIO report SubNetIO report FlowScan SoftwareComponents • Perl • Perl modules • Patched cflowd • RRDtool • Unix or GNU/Linux • Cron • Make
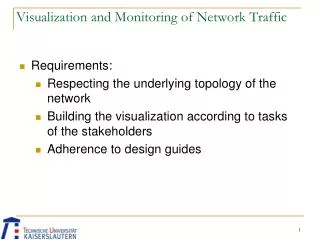
Short Term Analysis • Graphs over a short, recent time frame are based upon five-minute intervals. • Network abuse, such as flood-based Denial of Service attacks, are easily visible as "stalagmites" and "stalactites". These would be hidden in coarser-grained long-term graphs • This Example: • Flood of outbound 40-byte TCP RST reply packets • Flood of inbound 40-byte TCP ACK packets • Resulted in as much as 10,000 flows per second
Short Term AnalysisBits, Packets, Flows Graphs48 hours, 4-6 Nov 2000 • 2000/11/05 ~0200 -> ~1000 Apparently peering w/Abilene was down. (This was due to changes at AADS) • 2000/11/05 ~0415 -> ~1100 outbound flood of UDP packets ~10,000 packets per second • 2000/11/05 ~0800, ~0830 inbound flood of 1500 byte ICMP ECHO and ECHOREPLY packets destined for a campus dial-up user. This amounted to as much as 25 Mb/s. • 2000/11/05 ~1400 -> ? Apparently peering w/Abilene was down again. StarTAP too. (More problems at AADS) • 2000/11/06 ~0730 AADS got things back together connectivity to Abilene and StarTAP restored.
CampusIOISP Traffic, 10-11 NOV 2000 • Graph by Alexander Kunz <Alexander.Kunz@nextra.de>, 2000.
CampusIOUniversity of Wisconsin - Parkside10-11 Nov 2000 • Graph by Steven Premeau <premeau@uwp.edu>, 2000.
Long Term Analysis • Daily average graphs aid capacity planning and traffic shaping efforts. • This example: • Graph produced 2000/09/21 over past 550 days • academic calendar dramatically influences the traffic levels, but only to and from ResNet. • increase in outbound ftp traffic from the Computer Sciences department within the past year. • outbound traffic has consistently exceeded our inbound traffic level, the discrepancy between the two appears to be increasing.
CampusIO NapsterDaily AveragesMarch Through September 2000 • Note that these are daily averages, five minute peak Napster traffic would be higher • Note two "horns" or spikes in late March and Septemember. These represent some of the highest outbound daily averages observed and will be explored in the subsequent slides.
CampusIO EventsRedHat 6.2 ReleaseC. Wednesday 29 Mar 2000 • Spent an hour or two investigating increased CS traffic before coming in that morning • Found traffic to be TCP on ports >1024, host addresses indicated that it was likely to be PASV mode ftp data • Jump was from ~5Mb/s to ~30Mb/s • David Parter of CS informed me that their RedHat mirror was made active about that time
CampusIO EventsRedHat 7 Release"Black" Monday, 25 Sep 2000 • PASV mode ftp detection built-into CampusIO by this time • Jump from 5-10Mb/s to 50-60Mb/s for CS; another RedHat mirror is in the "blue", Student Information Technology • Notice flat-topping in daily peaks. This is due to the hitting capacity of WiscNet's commodity internet connectivity to Chicago • at capacity of upstream links for nearly entire days
CampusIO Events"All in 2 day's work"Monday & Tuesday, 23-24 Oct 2000 • Note arrow of time and events occur left to right: • 2000/10/03 0500 peer router upgrade, RSP4 -> RSP8, OC3 -> OC12 • 2000/10/03 1525 campus to peer cutover from OC3 to OC12 • 2000/10/03 1915 experimenting with rate-limits • 2000/10/04 1100 napster.com outage? • 2000/10/04 1615 48-byte TCP inbound DoS flood • 2000/10/04 1830 ResNet -> world rate-limit applied • 2000/10/04 2100 40-byte TCP SYN outbound DoS flood
CampusIO Events"All in 2 day's work"Monday & Tuesday, 23-24 Oct 2000
CampusIO Events"All in 2 day's work"Monday & Tuesday, 23-24 Oct 2000 • A method to visualize "events" and correlate real-world incidents with automated measurement • Working on a generalized approach for instrumenting the Internet to provide this sort of info to sites and researchers
CampusIO Events"All in 2 day's work"Monday & Tuesday, 23-24 Oct 2000
CampusIO ASNsUW-Madison Peers • There is the need in large networks to determine the amount of traffic that each other Autonomous System (AS) sources, sinks, or carries for your institution • These information is used to make informed peering and provisioning decisions • UW-Madison peers with many others, most of our traffic is passed to WiscNet and Abilene
CampusIO ASNsUW-Madison PeersWednesday & Thursday, 1-2 Nov 2000
SubNetIO Report • SubNetIO is another "canned" FlowScan report • It is derived from CampusIO; It reports traffic to and from campus done by individual subnets • These examples: • WiscWorld 33.6K and 56K bps dial pool traffic; note inbound DoS attack to at about 3PM • DoIT DSL service rivals the amount of traffic with only a fraction of the number of users; graphs is more erratic because of the smaller population of users
FlowScanCredits & Thanks • Daniel McRobb and CAIDA for cflowd • Tobi Oetiker and CAIDA for RRDtool • Perl authors and developers for perl and CPAN • Free Software Foundation for GNU • UW-Madison DoIT's Network Operations and Network Engineering Technology groups for mentoring and support
FlowScanA Network Traffic Reporting and Visualization Tool http://net.doit.wisc.edu /~plonka/FlowScan/