Download
1 / 15
150 likes | 188 Views
SimMetrics is a tool for project managers to create PowerPoint presentations from Excel data, offering insights on software metrics. Explore metrics categories, examples, and future plans for enhanced features.

E N D
SimMetrics: A Software Metrics Acquisition and Visualization Tool CS 426: Senior Projects, Spring 2005 Students: Eiler, Derek Leong, Herman Penrod, Nathan • Project Advisors: • Sergiu Dascalu, Ph.D. • Brian Westphal, M.S. • Norm Brown, Ph.D.
Overview • Introduction: “What is SimMetrics?” • Review of Software Metrics • Related Software: DataDrill, MindManager • SimMetrics GUI • Future Work • Questions/Answers
Introduction • SimMetrics is a tool designed for software project managers • Creates PowerPoint presentations from data in Excel spreadsheets • Used to generate informative visual representations of software metrics data • Generic interface design will allow for program extensibility
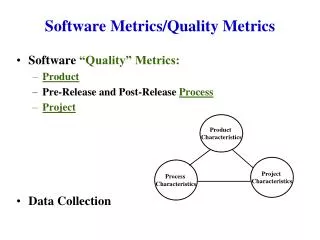
What Are Software Metrics? • Measurable factors related to the development of software • Help indicate potential problems in the development process • Used by project managers to produce quality software in a timely manner • Defining new, more informative metrics is an active area of research
Categories of Metrics Schedule Performance and Confidence • Functional Delivery Progress • Test Progress • Integration Progress • Milestone Migration • Defect Resolution • Defect Aging Risks • Top Software Risks • Software Risks on Programs Critical Path • Staffing Forecast • Requirements Progress • CPU / Memory Utilization • Speed of Execution Earned Value • Specific Earned Value • Specific Estimated at Completion
Examples of Software Metrics Functional Delivery Progress • Planned Delivery Date: When software functionality was initially planned to be fully tested and integrated. • Re-Planned Delivery Date: Each revised planned delivery date. • Delivered Date: When planned software functionality actually becomes available
FUNCTIONAL DELIVERY PROGRESS 1 Build 1 Build 2 Build 3 Build 4 Build 5 Date Date Date Date Date Function 1 Function 2 Function 3 Function 4 ... Function 5 Tie to IMSWhere Possible ... ... ... Function n Today Fully Implemented Planned Partially Implemented Replanned Unimplemented
Examples of Software Metrics Defect resolution • Number of defects reported • Number of reported defects that haven't been fixed Defect Aging • Number of months to repair a known defect • Category 1 Defect: System Abort – Prevents accomplishment of a mission-essential capability of jeopardizes safety • Category 2 Defect: System Degraded – No Work-Around. Adversely affects accomplishment of an operational or mission-essential capability for which no work around solution is known
4 5 5 DEFECT RESOLUTION DEFECT AGING 4 DEFECT RESOLUTION # Reported # Not Fixed Months DEFECT AGING Age of Unfixed Defects 16 Months Unfixed 8 Category 1 Defect 4 2 Category 2 Defect 1 Number Unfixed Defects by Age
DataDrill • Similar concept to SimMetrics • Manages software metrics • Provides graphical visualizations • Web interface design • Data is centralized • Information is shared • Differs in that it is not as flexible as our concept
MindManager • Another similar tool • Used in process management and planning • Features Microsoft Office integration • Differs in that it does not focus completely on metrics
GUI Preview: Main Window Visualization Preview Pane Configuration Pane Data Entry Pane Presentation Organizer Pane
GUI Preview: Sample Configuration Window Layout defined by respective Visualization Module
Future Work • Generate Macromedia Flash presentations as output. • Generate HTML web pages as output. • Provide a graphical interface for specifying new visualization modules. • Voice recognition for control of the application.