Download
1 / 54
540 likes | 756 Views
Network Measurement for KREONET -FlowScan-. 2002.9.26 이만희 KISTI/KREONET. 목차. Measurement 소개 FlowScan, FlowScan+? FlowScan 설치법 부록 : FlowScan+ 이용 해킹 보고서. Why Network Measurement?. Network Operators ’ View Is the network reliable? How is the network used?

E N D
Network Measurement for KREONET-FlowScan- 2002.9.26 이만희 KISTI/KREONET
목차 • Measurement 소개 • FlowScan, FlowScan+? • FlowScan 설치법 • 부록: FlowScan+ 이용 해킹 보고서
Why Network Measurement? • Network Operators’ View • Is the network reliable? • How is the network used? • When should the network be upgraded? • Network Users’ View • How much do I use the network? • Should I invest more or not? • Does the Service Provider abide by its agreement?
Active Measurement • Method • inject measurement traffic into the network • Metric • Round Trip Time, Packet loss, Topology • Tools • Ping, Traceroute, NIMI, Surveyor, PingER, AMP
Passive Measurement • Method • Do not inject traffic but observe traffic • Metric • Link Utilization, Traffic Analysis • Tools • Tcpdump, MRTG, FlowScan, CoralReef
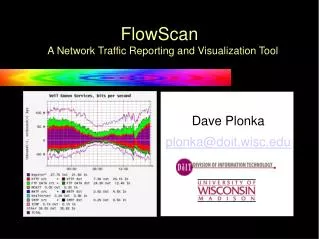
What is FlowScan? • A Network Traffic Flow Reporting and Visualization Tool developed by Dave Plonka • FlowScan은 CISCO router서 보내는 flow data를 분석하여 유용한 정보를 얻어내는 tool • FlowScan은 다음의 세 가지 Perl script module로 구성 • a flow collection engine (a patched version of cflowd) • High performance database(Round Robin Database - RRD) • a visualization tool (RRDtool) • FlowScan은 network의 border traffic을 측정하여 실시간에 거의 근접하게(5분 단위) 그래프를 만들어 준다.
Hardware • Netflow version 5가 export 가능한 CISCO router, CiscoIOS Release 12.0 and later releases는 대부분 지원 • Router에서 export된 flow 정보를 FlowScan이 설치된 컴퓨터에서 분석하여 트래픽 정보를 그래프로 그림 • FlowScan 시스템: Sparc machine의 Solaris, Intel machine의 GNU/Linux, *BSD 에 설치 가능 • 가능한 좋은 성능의 시스템 사용 권장(Dual CPU, 고용량 SCSI 하드 디스크 등)
What is flow? • Packets with the same src ip & port, dst ip & port, protocol # • NetFlow – flow information exported by CISCO router • FlowScan uses NetFlow data to analyze the traffic data.
Software 1/3 - cflowd • Original cflowd : cflowdmux, cflowd, flowcollector • FlowScan: cflowdmux와 cflowd 를 사용 • Router에서 NetFlow version 5로 UDP 분석 machine에 전송 • cflowdmux가 이 정보를 받아 cflowd로 보내 줌 • cflowd는 이 정보를 받아 미리 정의된 포맷으로 디스크에 기록, 5분 단위
Software 2/3 – FlowScan • FlowScan.pm 이라는 Perl script로 쓰여져 있음 • FlowScan은 cflowd에서 기록된 flow dump 파일을 분석한 뒤 RRD(Round Robin Datase)에 기록 • DB에는 Flow의 몇 가지 통계적인 정보를 저장하고 분석
Software 3/3 – RRDtool • DB의 정보를 이용해 time-series graph를 그림 • RRDtool은 여러 개의 RRD file을 사용해 flow의 통계 정보를 저장 • RRDtool과 RRGrapher는 GIF나 PNG형식의 포맷으로 graph 작성
What is FlowScan+? • Goal: Improve FlowScan by attaching query interface for detail analysis. • Motivation • Lack of traffic measurement tool that supports real time visualization and detailed information on demand. • Provide flexibility in analyzing network traffic to Network Engineers and Administrator. • Why FlowScan? • FlowScan is open source program and provides good visualization through the Web, yet does not support query interface. • Who? • KISTI, KAIST
Advantages and Disadvantages • The Existing FlowScan • Provides real-time network status graph and set of information to show the trend of network status and usage. • More Possible information can be drawn from NetFlow data. • Amount of traffic used by certain host, inter AS traffic amount, packet distribution, etc…
Major Improvement Point from Existing FlowScan • Using DBMS • for support flexibility when querying • MySQL adopted • Web supported query interface • More information on traffic data and statistical analysis can be obtained by demand. We named the improved version of FlowScan, FlowScan+
Predefined query(by user interface)to raw flows • Total traffic statistic • All flows in specific time period • Trace traffic used by specific user • Protocol statistic • Port statistic • As statistic • Nexthop statistic • Packet , flow distribution
Data Aggregation netflow Front table AS Table Bypass Aggregation ……... Port Table Rawflows Top User Table Protocol Table
Data Aggregation (cont’d) • First, all incoming NetFlow data are inserted to front table • Aggregation module is automatically called every 15 minute • After finishing all aggregation, all data in front table are moved to raw flows table • In some aggregation, preserve 90% information but only save 20% aggregated data • Query time is reduced (very much) • Eventually, old data of raw flows in table ‘rawflows’ will be deleted due to storage shortage. But aggregated data will be stored forever
Problems • Amount of data (under no sampling on KOREN/KREONet2 – STAR TAP router) • 45Mbps 링크에서 50% 정도 usage 있을 때 • 약 115414 flows/5 min, 6MB/5min, 1.7GB/day • DDoS 공격시, 30~50MB/5min, 10GB/day • Reporting time : more than 1 minute, sometimes over 10 minutes • KISTI and KAIST mending now
FlowScan+ Archetecture FlowScan FlowScan+
FlowScan vs FlowScan + • FlowScan provides • Traffic analysis by amount of bytes, packets, and flows. • Traffic by IP Protocol, application • Top inbound/outbound AS • Top inbound/outbound path AS • Specific vs Total • FlowScan+ provides • All that FlowScan provides. • Analysis by desired time period. • Detailed Information on traffic between AS’s • Nexthop • One can use FlowScan to see the trend of network traffic, and then use FlowScan+ module to analyze certain aspect in detail.
Deployment of FlowScan+ • KOREN/KREONet2-STARTAP International Link • 45 Mbps International Link • http://flowscan.kreonet2.net • Campus Network-KAIST • On weather map of KAIST • http://moran.kaist.ac.kr
Traffic From KREONET-STARTAP Links (by Flows) 2002.1.23 KREONET-STARTAP
Using FlowScan+ to analyze abnormality in the Network • Possible detection of DoS attack
Other Anomalies • Network Worm Virus • When there is large portion of sudden smtp traffic is shown, one can suspect the possible existence of worm virus over the network. • Code Red, Nimda? • Port Scanning • Hacking/Cracking Trials • Etc..
FlowScan 설치 Guide • 라우터 환경 설정 • FlowScan 시스템 설정
라우터 환경 설정 • CISCO 7507 라우터 IOS 12.0(15)S3 • #config terminal • (config)#ip flow-cache timeout inactive 300 • (config)#ip flow-cache timeout active 1 또는 ip flow-cache active-timeout 1 • (config)#ip flow-export version 5 • (config)#ip flow-export destination 150.183.235.100 2055 • (config)#ip cef <distributed> //VIP가 있는 라우터에서 각 인터페이스에서 각각 수행하도록 함 • Ingress interface에 대해서 아래 명령 수행 • (config)#interface Ethernet1 • (config-if)#ip route-cache flow
FlowScan 환경 설정 준비 • FreeBSD 4.3 기본 package 설치(이상 버전도 가능, linux도 설치 가능하지만 package 설치가 간단하여 FreeBSD를 많이 선호함) • Package 설치법: /stand/sysinstall -> Configure-> packages->CD-ROM or ftp 선택 -> all or 해당 그룹 선정->install
FlowScan 환경 설정 1 • perl5(기본으로 설치되어 있음) • arts++-1-1-a8_1 • autoconf-2.13 • GNU bison-1.28 • gmake-3.79.1 • pdksh-5.2.14
FlowScan 환경 설정 2 • Cflowd, cflowd patch • http://net.doit.wisc.edu/~plonka/cflowd/?M=D • cflowd-2-1-b1.tar.gz cflowd-2-1-b1-djp.patch 를 다운 받음 • 각 파일을 같은 디렉터리 상에 복사한 뒤, 다음의 절차를 거쳐 patch와 설치 • patch 방법 # gunzip -c cflowd-2-1-b1.tar.gz |tar xf – # cd cflowd-2-1-b1 # patch -p0 < ../cflowd-2-1-b1-djp.patch # autoconf # optional • cflowd 설치 방법 # ./configure --with-artspp=/usr/local # make # make install • 쉘 설정 파일 내에 다음 path를 추가 set path = (… /usr/local/arts/bin /usr/local/arts/sbin) #rehash
FlowScan 환경 설정 3 • RRD 설치 • http://people.ee.ethz.ch/~oetiker/webtools/rrdtool/pub/ • Package에도 있지만 source compile을 권장 • 설치 방법 # gunzip –c rrdtool-1.0.33.tar.gz | tar xf – # cd rrdtool-1.0.33 # ./configure --enable-shared # make install site-perl-install • 쉘 설정 파일 내에 다음 path를 추가 set path = (… /usr/local/rrdtool-1.0.33/bin) # rehash
FlowScan 환경 설정 4 • Perl 모듈 설치 • /stand/sysinstall에서 package 형태로 설치 • p5-Boulder-1.20 • p5-Cflow-1.03 • p5-ConfigReader-0.5_1 • p5-HTML-Table-1.07b • p5-Net-Patricia-1.010
FlowScan 환경 설정 5 • FlowScan-1.006설치 • http://net.doit.wisc.edu/~plonka/FlowScan/ • 설치 방법: # ./configure --prefix=/usr/flows • (configure에서 rrdtool이 없다는 error 나면 configure 화일 편집하여ac_cv_path_RRDTOOL_PATH='/usr/local/rrdtool-1.0.33' 를 추가) # make # make -n install # make install # mkdir –p /usr/flows/graphs • 쉘 설정 파일 내에 다음 path를 추가한다. set path = (… /usr/flows/bin) # rehash
FlowScan 환경 설정 6 • clfowd 환경 셋업 • cp/usr/local/arts/etc/cflowd.conf.example /usr/local/arts/etc/cflowd.conf • vi /usr/local/arts/etc/cflowd.conf • OPTIONS { LOGFACILITY: local6 TCPCOLLECTPORT: 2056 PKTBUFSIZE: 4000000 TABLESOCKFILE: /usr/local/arts/etc/cflowdtable.socket FLOWDIR: /usr/flows FLOWFILELEN: 1000000 NUMFLOWFILES: 10 MINLOGMISSED: 300 }
FlowScan 환경 설정 7 • cflowd 환경 셋업 계속 COLLECTOR { HOST: 150.183.235.100 # IP address of central collector ADDRESSES: { 150.183.235.100 } AUTH: none } CISCOEXPORTER { HOST: 134.75.20.** # IP address of Cisco sending data. ADDRESSES: { 134.75.20.***, # Addresses of interfaces on Cisco 210.218.215.***, 134.75.108.***, 150.183.2.***} # sending data. CFDATAPORT: 2055 # Port on which to listen for data. SNMPCOMM: ‘******' # SNMP community name. LOCALAS: 17579 # Local AS of Cisco sending data. COLLECT: { protocol, portmatrix, ifmatrix, nexthop, netmatrix, asmatrix, tos, flows } }
FlowScan 환경 설정 8 • # cflowdmux • # cflowd –s 300 –O 0 –m • 결과로 /usr/flows에 ip.flows.0~9 파일과 flows.current라는 파일이 생기고 flows.current의 크기가 점점 늘어난다면 성공 • 5분 뒤에 flows.20010928_09:15:04+0900 와 같은 형태의 파일이 dump될 것임 • # ps –ax |grep flow 279 ?? S 0:00.18 cflowdmux 281 ?? S 0:05.60 cflowd -s 300 -O 0 –m
FlowScan 환경 설정 9 • flowscan 설치 디렉토리에서 /usr/flows/bin 에 아래 화일들 복사 • CampusIO.cf, flowscan.cf, local_nets.boulder, Napster_subnets.boulder • flowscan.cf FlowFileGlob /usr/flows/flows.*:*[0-9] ReportClasses CampusIO WaitSeconds 300 Verbose 1
FlowScan 환경 설정 10 • CampusIO.cf OutputIfIndexes 2, 9 LocalSubnetFiles /usr/flows/bin/local_nets.boulder OutputDir /usr/flows/graphs Protocols icmp, tcp, udp TCPServices ftp-data, ftp, smtp, nntp, http, 7070, 554, 1863, 5004 NapsterSubnetFiles /usr/flows/bin/Napster_subnets.boulder NapsterSeconds 1800 NapsterPorts 8875, 4444, 5555, 6666, 6697, 6688, 6699, 7777, 8888 ASPairs 0:0 TopN 10 • local_nets.boulder SUBNET=137.68.200.0/24 DESCRIPTION=our network1 = SUBNET=137.68.201.0/24 DESCRIPTION=our network2
FlowScan 환경 설정 11 • # flowscan • 아래와 같은 화면이 나오면 설치 성공
FlowScan 환경 설정 12 • Save old flows • # mkdir /usr/flows/saved • # mkdir /usr/flows/other • # touch /usr/flows/saved/.gzip_lock • 그래프 생성 • # cp graphs.mf /usr/flows/graphs/Makefile • # cd /usr/flows/graphs • # gmake • 554_dst.rrd를 찾을 수 없다는 메시지가 나오면 다음과 같은 명령으로 rrd파일을 수동으로 만듬 # rrdtool create 554_dst.rrd --step 300 \ DS:in_bytes:ABSOLUTE:400:U:U \ DS:out_bytes:ABSOLUTE:400:U:U \ DS:in_pkts:ABSOLUTE:400:U:U \ DS:out_pkts:ABSOLUTE:400:U:U \ DS:in_flows:ABSOLUTE:400:U:U \ DS:out_flows:ABSOLUTE:400:U:U \ RRA:AVERAGE:0:1:600 \ RRA:AVERAGE:0:6:600 \ RRA:AVERAGE:0:24:600 \ RRA:AVERAGE:0:288:732 \ RRA:MAX:0:24:600 \ RRA:MAX:0:288:732
FlowScan 환경 설정 13 • crontab 설정 # { FlowScan stuff: # # make the graphs: 0,5,10,15,20,25,30,35,40,45,50,55 * * * * test -f /usr/flows/graphs/Makefile && cd /usr/flows/graphs && /usr/local/bin/gmake -s >/dev/null # #copy files in internet directory 3,8,13,18,23,28,33,38,43,48,53,58 * * * * cp /usr/flows/graphs/*.png /usr/local/webdocument/ && cp /usr/flows/graphs/*.html /usr/local/webdocument/ # # gzip the saved flow files: 2,7,12,17,22,27,32,37,42,47,52,57 * * * * test -d /usr/flows/saved && cd /usr/flows/saved && /usr/flows/bin/locker -ne .gzip_lock "/usr/local/bin/ksh -c '/bin/ls flows.[0-9]!(*.gz) 2>/dev/null | /usr/bin/xargs -n1 /usr/bin/gzip'" # # Purge the flow files: # find(1) -mtime +1 was insufficient - I want to delete them as soon as they're # `n' hours old: 0 * * * * /usr/bin/find /usr/flows/saved -type f -name 'flows.*' -print |/usr/bin/perl -e '$now = time; $seconds = 28*60*60; while (<>) { chomp; (@_ = stat $_) && ($now - $_[9] > $seconds) && print $_, "\n" }' |/usr/bin/xargs /bin/rm -f # }