Download
1 / 4
40 likes | 125 Views
This study provides analysis of seismic surveys, well calculations, and gas anomalies for potential hydrocarbon reservoirs in Apache's licensed acreage. Includes structural and depth maps.

E N D
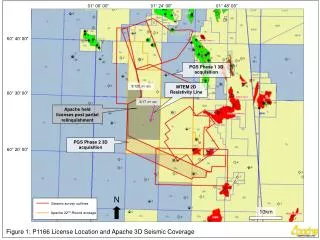
01° 00’ 00” 01° 24’ 00” 01° 48’ 00” 60° 40’ 00” PGS Phase 1 3D acquisition 3/12b (P1166) MTEM 2D Resistivity Line 60° 30’ 00” 3/17 (P1166) Apache held licenses post partial relinquishment PGS Phase 2 3D acquisition 60° 20’ 00” N Seismic survey outlines 10km Apache 22nd Round acreage Figure 1: P1166 License Location and Apache 3D Seismic Coverage
Eocene NTG well calculations illustrated by pie charts Skiddaw Eocene Class 3 AVO gas Anomalies Figure 2: Tryfan Hydrocarbon Anomaly Map and Semblance Image
Skiddaw Jurassic Closure Skiddaw Cretaceous Closure Schematic Line (Figure 4) Ekofisk Top Depth Map BCU Top Depth Map Figure 3: Skiddaw Cretaceous and Jurassic Structural Maps
SSW Figure 4: Skiddaw Schematic