Download
1 / 34
340 likes | 474 Views
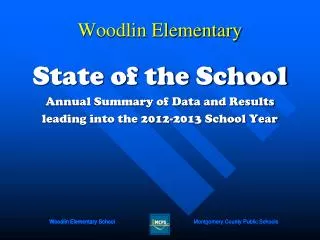
This annual summary presents the key performance data and results for Woodlin Elementary School as it approached the 2012-2013 school year. It includes insights on enrollment trends, demographic data, reading benchmarks from mClass, and academic progress measures from MAP-R and MSA assessments. The report highlights achievements in reading and math for students, along with areas needing improvement based on climate survey feedback from staff, students, and parents. The findings aim to guide strategic planning for continued educational success.

E N D
Woodlin Elementary State of the School Annual Summary of Data and Results leading into the 2012-2013 School Year
Together We Explore, Learn, and Succeed Woodlin Performance Data • Enrollment Trends • Population Demographics • mClass Reading Reading benchmark testing-Grades K, 1, 2 • MAP-R Measures of Academic Progress in Reading –Grades 3, 4, 5 • MSA Maryland School Assessment-Grades 3, 4, 5 • Math Unit By course enrollment based on end of year mastery-Discontinued • TN2 Terra Nova Two-Grade 2-Discontinued • Climate Survey Data Annual survey-staff, random sample of parents, grade 3, 5 students
Spring 2012 MAP-R% Meeting Target RIT for Grades 3-4-5- combined
MAP-R (Measures of Academic Progress- Reading)% Meeting Target RIT by Spring 2012
MAP-P (Measures of Academic Progress-Primary Math)% Meeting Target RIT by Spring 2012
Reading Math Grade Grade Proficient Proficient Advanced Advanced 3 388 456 3 379 441 4 371 437 4 374 433 5 384 425 5 392 453 MSA Cut Scores
Maryland Accountability Program • AMO Progress • Reduce by half the percentage of students in the “all students” group and in each subgroup who are not proficient within six years. • School Progress Index • Achievement • Growth • Gap Reduction • College & Career Readiness
Maryland School Progress Index Elementary/Middle Schools High Schools
SPI Calculation Example: Elementary/Middle School School Index range from 0 to greater than 1. 0 = No targets met 1 = All targets met 1+ = Targets exceeded
Reading MSA2012 The target for each group is different and based on 2011 baseline performance. The goal is to reduce The percent of students scoring “basic” by 50% Over the baseline by the year 2017
Math MSA2012 The target for each group is different and based on 2011 baseline performance. The goal is to reduce The percent of students scoring “basic” by 50% Over the baseline by the year 2017
Selected Celebrations • All grade levels (K-2) had more than 90% of students meet the reading target! • 3% increase of last year’s 4th graders and 11% increase of 5th graders on MAP-R! • 7 of 8 subgroups met or exceeded the Reading MSAbenchmark of 90.6%! (benchmark prior to reauthorization) • FARMS students increase by 7% on Math MSA and almost 12.5% increase over the past 2 years!
Student Survey Students are well behaved (↑19.5%) Students care about one another in this school (↑17.2%) There is an adult at school I can talk to when I have a problem (↑18.2%) It is easy to talk to teachers about things that bother me(↑18.5%) Bully and Teasing is a problem (26.3% and 23.8%) Parent Survey No gains of 3.0% or higher on the parent survey. Climate SurveyHighlighted Gains(Gains greater than 3.0% points)
Student Survey I feel safe at school (↓6.7%) My teachers listen to my ideas (↓6.3%) I get along with students in this school (↓2.1%) Parent Survey School does a good job of welcoming families of diverse cultures (↓2.6%) School does a good job of informing me about meetings and special events (↓4.1%) The school has a clear process for addressing concerns (↓9.3%) Climate SurveyHighlighted Areas of Need
Student Survey School staff encourages students to respect others (97.2%) My teachers help me when I don’t understand (96.3%) My teachers have high expectations for me to do well in school (95.3%) Parent Survey Teacher expect my child to do well in class (96.9%) My child feels safe at school (96.9%) My child’s teachers expect my child to do well in class (96.9%) Provides a variety of ways to volunteer (96.8%) School leadership is accessible when needed (98.9%) Climate SurveyTop 3 Areas
Student Survey It is easy to talk to teachers about things that bother me (64.8%) If I got in trouble, the school staff would treat me fairly (68.6%) My belongings are safe in this school (69.0%) Parent Survey The school has a clear process for addressing my concerns (85.6%) My child’s teacher takes action to resolve my concerns (92.5%) It is easy for me to talk to my child’s teacher about things concerning my child (88.8%) Climate SurveyLowest 3 Areas
Strengths (100%) Collaborate w/ colleagues Help & support from colleagues Teachers motivate students to learn School has high expectations for academic performance Teachers are well prepared to teach Safe place to work Would recommend as a good place to work Relative Areas of Need The number of students given to me is manageable (66.7%) I have time during workday to plan instruction for my students (50.0%) System-wide professional development opportunities meet my needs (68.9%) Bathrooms are kept well supplied (48.9%) Climate SurveyStaff Trends: Top 3
Trending downward Climate SurveyTeasing: Percent positive response
Action Items &Next Steps • Effective co-teaching • Relationships and High Expectations!!! • Academic Focus Clubs • Inquiry groups on areas of professional growth during staff meetings