Download
1 / 31
310 likes | 453 Views
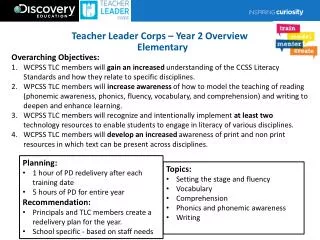
Woodlin Elementary. State of the School Annual Summary of Data and Results leading into the 2010 School Year. Together We Explore, Learn, and Succeed. Woodlin Performance Data. Enrollment Trends Population Demographics mClass Reading Reading benchmark testing-Grades K, 1, 2 MAP-R

E N D
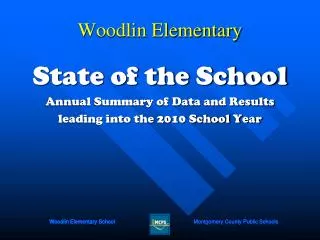
Woodlin Elementary State of the School Annual Summary of Data and Results leading into the 2010 School Year
Together We Explore, Learn, and Succeed Woodlin Performance Data • Enrollment Trends • Population Demographics • mClass Reading Reading benchmark testing-Grades K, 1, 2 • MAP-R Measures of Academic Progress in Reading –Grades 3, 4, 5 • MSA Maryland School Assessment-Grades 3, 4, 5 • TN2 Terra Nova Two-Grade 2 • Climate Survey Data Annual survey-staff, random sample of parents, grade 3, 5 students
Spring 2010 MAP-R% Meeting Target RIT for Grades 3-4-5- combined
Reading Math Grade Grade Proficient Proficient Advanced Advanced 3 388 456 3 379 441 4 371 437 4 374 433 5 384 425 5 392 453 MSA Cut Scores
Reading MSA 2010 Target AMO was 81.2%
Math MSA 2010 Target AMO was 79.4%
Selected Celebrations • PRIMARY READING • K: 93% of all students! • 1st: 92% of AA students! • 2nd: 88% of Hispanic students! • MSA Reading • ELL and SPED students at all time high of 100%! • Hispanic students at the advanced levels increased 3.2% to 22.2% • MSA Math • 100% of 4th grade & 85.7% of SPED students! • AA students advanced increased 6.1% to 14.1%
2nd Grade TN2 PerformancePercent of students at or above 50th %ile Target is 70% of students
2010 2nd Grade TN2 PerformancePercent of students at or above 50th %ile Target is 70% of students at the 50th %ile
Climate SurveyBackground Information **Note** The parent survey was changed in 2010 to be a random sample. Previous years were a total school community survey
Student Survey Teacher explains homework (↑4.3%) School staff is friendly and helpful (↑4.9%) Parent Survey Teachers keep me informed (↑4.2%) Important information is communicated to families (↑3.0%) School is welcoming to families of diverse cultures (↑3.2%) Climate SurveyHighlighted Gains(Gains greater than 3.0% points)
Student Survey I feel welcomed at this school (↓14.1%) It’s easy to talk to teachers about things that bother me (↓20.9%) If I get in to trouble, the school staff treats me fairly (↓11.1%) Students are well behaved (↓15.6%) Parent Survey The school has a clear process for addressing my concerns (↓5.5%) Students teasing my child is a problem (↑4.0%%) Climate SurveyHighlighted Areas of Need(Decreases greater than 4.0% points)
Student Survey My teachers have high expectations (93.3%) School staff encourages students to respect others (93.3%) The school teaches students to be responsible for their own behavior (91.5%) Parent Survey The school does a good job of informing me about meetings and special events (98.5%) My child feels safe at school (98.5%) The school does a good job of getting important school information to parents (98.5%) Climate SurveyTop 3 Areas
Student Survey Students in this school are well behaved (40.8%) I can work in my classroom without being bothered by other students (42.0%) It is easy to talk to my teachers about things that bother me (46.6%) Parent Survey The school has a clear process for addressing my concerns (86.2%) There is an atmosphere of open communication in my child’s school (91.2%) It is easy for me to talk to my child’s teacher about things concerning my child (92.5%) Climate SurveyLowest 3 Areas
Strengths (100%) Staff Expectations Leadership support working with parents Satisfaction with work Safety (self and belongings) Recommend school as a place to work Discuss teaching methods with others Relative Areas of Need Extra duties are shared equitably (73.9%) I have time to plan instruction for my students (72.7%) School staff consistently enforce rules (74.1%) Bathrooms are kept well supplied (70.4%) Climate SurveyStaff Trends: Top 3
Trending upward Climate SurveyTeasing: Percent positive response
Trending upward Climate SurveyBullying : Percent positive response
Action Items &Next Steps • Review and renew commitment to Stop and Think and matrices • Bully Blockers Program • Weekly classroom communication instead of monthly grade level • More self-directed time to plan with teams • Continued research based reading interventions and inclusive service delivery with co-teaching