Download
1 / 55
550 likes | 722 Views
Event-related fMRI Contrast When Using Constant Interstimulus Interval: Theory and Experiment. Peter A. Bandettini & Robert W. Cox Steve Smith Psychology 670 Oct. 22, 2002. OR… The Peter Bandettini Event-Related fMRI Cookbook™: Constant ISI Version. Background Information

E N D
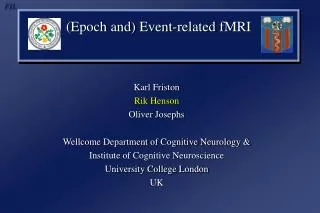
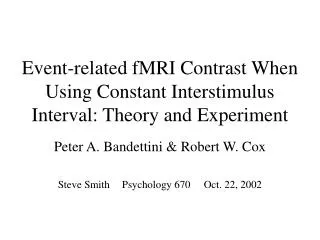
Event-related fMRI Contrast When Using Constant Interstimulus Interval: Theory and Experiment Peter A. Bandettini & Robert W. Cox Steve Smith Psychology 670 Oct. 22, 2002
OR… The Peter Bandettini Event-Related fMRI Cookbook™: Constant ISI Version
Background Information • Theory (translated from the original Greek) • Method of testing the theory • Analysis • Applying the Cookbook to our own Research (2 examples)
Optimal Designs • “Optimal designs are those that yield the largest estimated magnitudes with the best statistical properties while satisfying the behavioral constraints of the experiment” (Ollinger et al., 2001b) • low variance • equal variance across effects • minimum correlation among effects
time course of activation baseline rest % signal change images stimulation haemodynamic response function Stimulation protocols in fMRI Slide ruthlessly stolen from previous lecture
ER vs. Blocked Designs • Better randomization of task types in a time series • Allows for selective analysis of response data • particular stimuli • errors (and the accompanying “Oh Shit!” response) • Easier separation of motion artifacts (you can, in theory, look at particular trials)
Methodological Variables • Stimulus Duration (SD) • Interstimulus Interval (ISI) SD SD SD ISI ISI • Altering either SD or ISI alters the response function.
Methodological Variables • Stimulus Duration (SD) • Interstimulus Interval (ISI) SD SD SD ISI ISI • Altering either SD or ISI alters the response function.
Different ISI Patterns • Constant • (relatively) easy to analyze b/c they involve simple binning and averaging. • Does not require the assumption of linearity • Randomized (Mike’s presentation) • more time efficient • allow for shorter ISIs ISI ISI ISI ISI
Two Critical Questions • How does the statistical power of ER-fMRI compare to that of blocked designs? • What is the optimal ISI for a given SD?
Two Critical Questions • How does the statistical power of ER-fMRI compare to that of blocked designs? • What is the optimal ISI for a given SD?
Trade-off: Number of trials per unit time vs. the degree of attenuation of the hemodynamic signal that occurs with close temporal spacing of trials.
Three Components of a Signal: 1) pre-undershoot (approx. 2 sec) 2) signal (approx. 6-9 sec to plateau) 3) post-undershoot (approx. 3 sec)
A B • Signal attenuation or “clipping”: • If one trial begins before the hemodynamic response function has settled back to baseline, the two functions (trial 1 and 2) will interfere with each other.
Thus... • The purpose of this paper is to determine the optimal ISI for a given SD in a constant-ISI ER-fMRI design.
Bandettini’s Goal • Create a theoretical response function for constant-ISI ER-fMRI based on fancy-schmancy math. • Compare theoretical response function to experimental data.
The Theory (as I understand it) • We want to estimate the activation in each voxel. • The catch: we don’t know the response or the baseline level of activation. • Use matrix algebra magic to get estimators of response and baseline activation.
The Theory (as I understand it) • If the stimuli are far enough apart (i.e., the signals of each activation do not overlap), then we can accurately predict a response function. • If there is overlap, we get more intimidating Greek symbols. • Thus, we want to find a value that gives us a usable function rather than menacing symbols.
Participants • 5 people (probably Bandettini’s family) • data from 2 were lost due to motion artifacts.
Two Tasks • Passive viewing of an 8-Hz red square (presented through goggles) • Bilateral finger tapping • Tasks performed simultaneously (hmmm….)
Different ISIs ISI (sec) SD (sec) # of Cycles 20 20 924 2 1320 2 1616 2 2012 2 2510 2 308 2 366 2 454 2 602 2 90 Separate time series were run for 9 different ER-fMRI ISIs. One blocked time series was run for comparison.
Image Acquisition • Two axial imaging planes (visual and motor cortex) • Echoplanar imaging • TR = 1 sec • TE = 40 msec • Time series length = 360 images 3 x 3 x 7 = 63 mm3 non-isotropic From last lecture…”In general, larger voxels buy you more SNR, EXCEPT when the activated region does not fill the voxel (partial voluming)”
Hmmm... • What is gained by having the visual and motor stimulation simultaneous? • Will this pattern generalize to other areas? • Simple tasks (necessary, as this is a pilot study). Can we use this cookbook for more complex recipes?
average % signal change images Image Construction • Based ROI on data from blocked study. • Created average plots for each time series • Created a reference function (just a function in which the average function repeats over and over again.
. % signal change images Image Construction Cont’d • Created a correlation image (this is when you compare the obtained data to the average data) • Divided this image by the residual time series’ standard deviation for each voxel in order to create a functional contrast-to-noise image
Task validity: Visual and motor areas were found to be activated by the tasks.
At ISIs of 8 sec or less, the responses are blunted (over-lapping hemodynamic functions. Ideal ISI: approx. 10-12 sec (similar pattern to blocked)
The “cleanest” response function is found for ISIs of 10 and 12 sec (followed by 8). The rest suck.
ISI-10 and ISI-12 lead to images that are similar to blocked images in resolution.
Blocked vs. Optimal ER • The experimental contrast per unit time for ISI-12sec is only 35% lower than that of blocked designs. • For ISI-12sec, the stimulus is “on” for 14% of the time, whereas for blocked, the stimulus is “on” for 50% of the time.
In a simulation, Bandettini’s model produced data very similar to that found in the experiment.
The theoretical model produced a similar pattern, but peaked earlier. (Needs to account for post-activation undershoot.)
Sledge Hammer or Whipped Cream? • Pilot Study - blocked or constant-ISI ER • Test - depends on the question • Whipped Cream study - randomized-ISI ER
Before using constant ISIs, ask yourself: What phenomenon are we looking at? What subject population are we using? Will this give us the most bang-for-the-buck? Constant-ISI event-related fMRI is a useful tool in specific situations.
What would you use this sort of design to study? Could you apply it to your own research? • What patient populations should and should not be tested this way? • The constant-ISI generally shows that the hemodynamic response is slightly nonlinear. Since the randomized ISI design assumes linearity, should we be concerned?
Expectation of Pain • What areas of the brain ‘light up’ during (1) pain and (2) the expectation of pain? • Pain induced through a balloon that is inflated in one’s esophagus. • Nasal intubation
Three Types of Trials • Pain trials vs. Pleasure trials vs. No sensation • Pain = the balloon in the esophagus is inflated to a pre-determined threshold of pain • Pleasure = a puff of air on the wrist • No sensation = duh
Details • SD: 4 sec of conditioned stimulus + 4 sec of pain/pleasure/nothing. • ISI: 16 sec • TR = 1 sec • TE = 40 msec • (Don’t remember slice #’s, flip angle, etc).