Download
1 / 1
10 likes | 114 Views
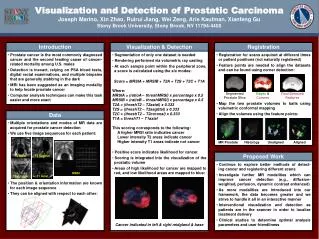
Prostate cancer is the most prevalent cancer in men and a leading cause of cancer mortality. Current detection methods, including PSA tests and biopsies, are often imprecise. This study explores the potential of MRI and computer analysis for improved cancer localization. Our method uses volumetric ray casting and employs a sophisticated scoring system based on multiple imaging modalities to enhance detection accuracy. By integrating visualization with likelihood scoring, we aim to better identify cancerous regions and facilitate treatment planning through real-time interventional visualization.

E N D
Visualization and Detection of Prostatic Carcinoma Joseph Marino, Xin Zhao, Ruirui Jiang, Wei Zeng, Arie Kaufman, Xianfeng Gu Stony Brook University, Stony Brook, NY 11794-4400 Introduction Visualization & Detection Registration • Prostate cancer is the most commonly diagnosed cancer and the second leading cause of cancer- related mortality among U.S. males • Detection is inexact, relying on PSA blood tests, digital rectal examinations, and multiple biopsies that are generally stabbing in the dark • MRI has been suggested as an imaging modality to help locate prostate cancer • Computer analysis techniques can make this task easier and more exact • Segmentation of only one dataset is needed • Rendering performed via volumetric ray casting • At each sample point within the peripheral zone, a score is calculated using the six modes: • Score = MRSIA + MRSIB + T2A + T2S + T2C + T1A • Where: • MRSIA = (ratioA – threshMRSI) x percentage x 0.5 • MRSIB = (ratioB – threshMRSI) x percentage x 0.5 • T2A = (threshT2 – T2axial) x 0.333 • T2S = (threshT2 – T2sagittal) x 0.333 • T2C = (threshT2 – T2coronal) x 0.333 • T1A = threshT1 – T1axial • This scoring corresponds to the following: • A higher MRSI ratio indicates cancer • Lower intensity T2 areas indicate cancer • Higher intensity T1 areas indicate not cancer • Positive score indicates likelihood for cancer. • Scoring is integrated into the visualization of the prostatic volume • Areas of high likelihood for cancer are mapped to red, and low likelihood areas are mapped to blue: • Cancer indicated in left & right midgland & base • Registration for scans acquired at different times or patient positions (not naturally registered) • Feature points are needed to align the datasets and can be found using corner detection: • Map the two prostate volumes to balls using volumetric conformal mapping • Align the volumes using the feature points: Segmented Prostate Slice Edges & Corners Final Detected Features Data • Multiple orientations and modes of MR data are acquired for prostate cancer detection • We use five image sequences for each patient: • The position & orientation information are known for each image sequence • They can be aligned with respect to each other: MR Prostate Histology Unaligned Aligned Proposed Work T2 Axial T2 Sagittal • Continue to explore better methods of detect- ing cancer and registering different scans • Investigate further MR modalities which can improve cancer detection (e.g., diffusion- weighted, perfusion, dynamic contrast enhanced) • As more modalities are introduced into our framework, the data becomes greater and we strive to handle it all in an interactive manner • Interventional visualization and detection as patients are in the scanner in order to localize treatment delivery • Clinical studies to determine optimal analysis parameters and user friendliness MRSI T2 Coronal T1 Axial