Arc Hydro groundwater data model
290 likes | 542 Views
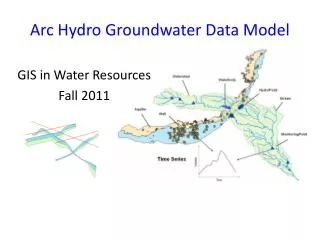
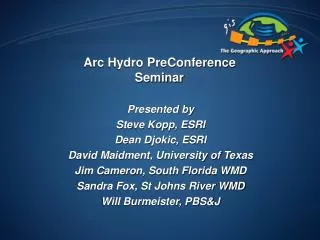
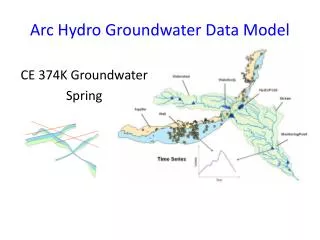
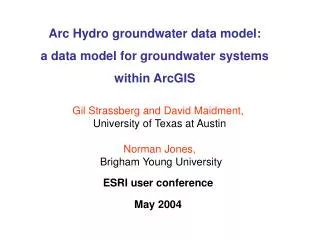
Arc Hydro groundwater data model. ESRI User Conference July 2005. Gil Strassberg, David R. Maidment, and Norman L. Jones. Arc Hydro surface water. A data model for representing surface water systems. Published by ESRI press, 2002. Goals of the data model. Objective.

Arc Hydro groundwater data model
E N D
Presentation Transcript
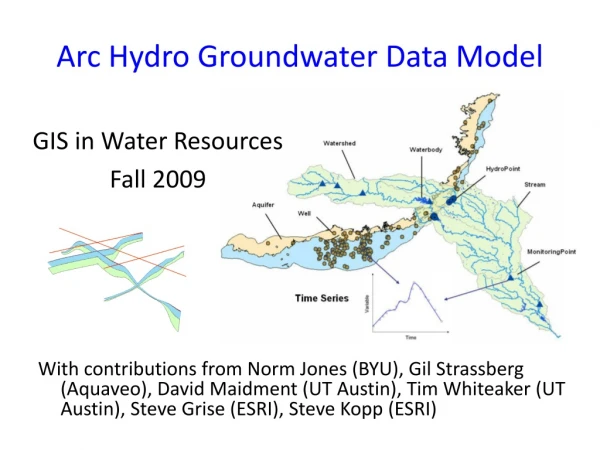
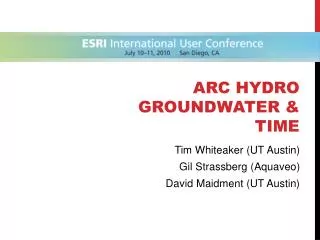
Arc Hydro groundwater data model ESRI User Conference July 2005 Gil Strassberg, David R. Maidment, and Norman L. Jones
Arc Hydro surface water A data model for representing surface water systems Published by ESRI press, 2002
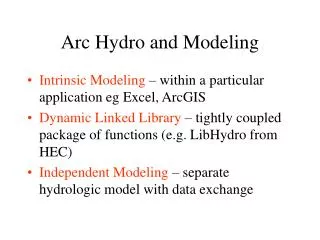
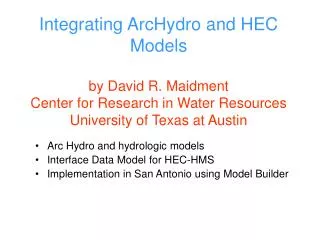
Goals of the data model Objective Develop a data model for representation of groundwater systems. Data model goals • Support representation of regional and site scale groundwater systems. • Enable the integration of surface water and groundwater data. • Connection to groundwater modeling software.
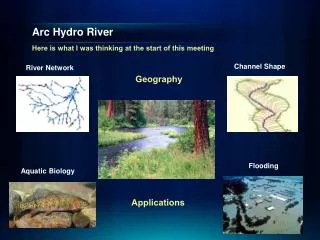
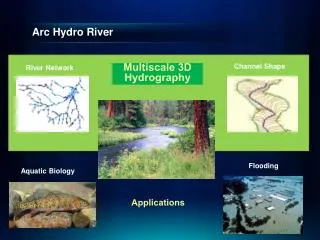
Regional groundwater systems • Usually the horizontal scale >> vertical scale • In many cases modeled as 2 dimensional flow system
Site scale groundwater studies Characterization of Savannah River Site in South Carolina • Usually model 3D flow to study mass transport • Important to establish a 3D model of the system
Integration of surface water and groundwater information Need to represent movement of water between the surface and subsurface Geographic relationship between the surface and groundwater elements Conjunctive view and analysis of information from groundwater and surface water systems
Connection to groundwater models Data model = Database Model input Model outputs
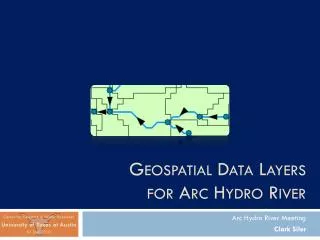
Data model framework Features describing the hydrogeology of the system Table that describes hydrogeologic units and their properties Features used in relation with modeling Raster catalog to represent geologic formations and parameter distribution Raster catalog to represent water related parameters Describes surfaces
Hydrogeology feature dataset Wells (points) Aquifer (2D Polygon) GeoArea (2D Polygon) GeoLine (2D line) GeoVolume (Multipatch) GeoSection (3D polygon) BoreLine (3D line)
Hydrogeologic unit Describes the hydrogeologic unit and links together the spatial representations Hydrogeologic unit table
GeoRasters Raster catalog • GeoRasters: • Distribution of properties • Define boundaries of hydrogeologic units Transmisivity Hydraulic conductivity Top of formation Formation base GeoRasters are usually constant over time Woodbine aquifer, Texas
Rasters Series describe water related properties over time Potentiometric surface Saturated thickness Contaminant concentration
Modeling feature dataset Connection to modeling tools: enable the preparation of model inputs and communication of model outputs 2 dimensional models 3 dimensional models
Tools Develop tools that help create and populate the data model classes • Many of the objects are three dimensional and require custom tools to populate the classes • Tools to connect with models
Example 1:Representing hydrogeology of an aquifer system North Carolina coastal aquifer system
North Carolina coastal aquifer system Section line * From USGS, Water Resources Data Report of North Carolina for WY 2002
Example 2:Representation of 3D site scale measurements Case study of the MADE (Macrodispersion Experiment) site
MADE site • Text files: • tracer concentrations • Hydraulic conductivity measurements • Hydraulic head measurements From Harvey and Gorelick. WATER RESOURCES RESEARCH, VOL. 36, NO. 3, PAGES 637–650, MARCH 2000
3D sampling ports A well can be related to multiple sampling ports
Querying and displaying 3D measurements Creates a new temporary layer with measurements for a specific variable, in a certain value range, at a selected time
Interpolation using new 3D tools Tetrahedral network of Bromide concentrations 3D interpolation tools Isosurfaces of Bromide concentrations
Example 3:Interfacing with MODFLOW Barton Spring segment of the Edwards aquifer GAM model
GAM models for the Edwards Aquifer • MODFLOW models are developed as part of the GAM models for Texas • Models can be downloaded from the TWDB website
Model Boundary Using external models we can create solid models that can then be stored and visualized within GIS
Barton Creek Williamson Creek Interstream recharge Slaughter Creek Bear Creek Onion Creek No recharge Model dimensions • The model is 1 layer with 120 by 120 cells • Each cell is 1000 by 500 • Steady state (20 years) and transient (10 years) models • Model Packages: Recharge, Well, Drain
Tools to populate the relevant classes in the data model from MODFLOW files
Aggregate and query the model results from GIS Define zones of interest through GIS Get Budgets for the defined zones
Future work • Finalize the conceptual data model design • Create a detailed database design • Get feedback from the groundwater community Refine the model and test on more case studies
For more information and updates Websites: ESRI Data models website: www.support.esri.com/datamodels Gil Strassberg website: https://webspace.utexas.edu/gstras/MyWebsite/ GIS Water Resources Consortium, CRWR UT Austin: http://www.crwr.utexas.edu/giswr/ Contacts: Gil Strassberg – gilstras@mail.utexas.edu David R. Maidment – Maidment@mail.utexas.edu Norman L. Jones njones@byu.edu