Spotlight on Student Data
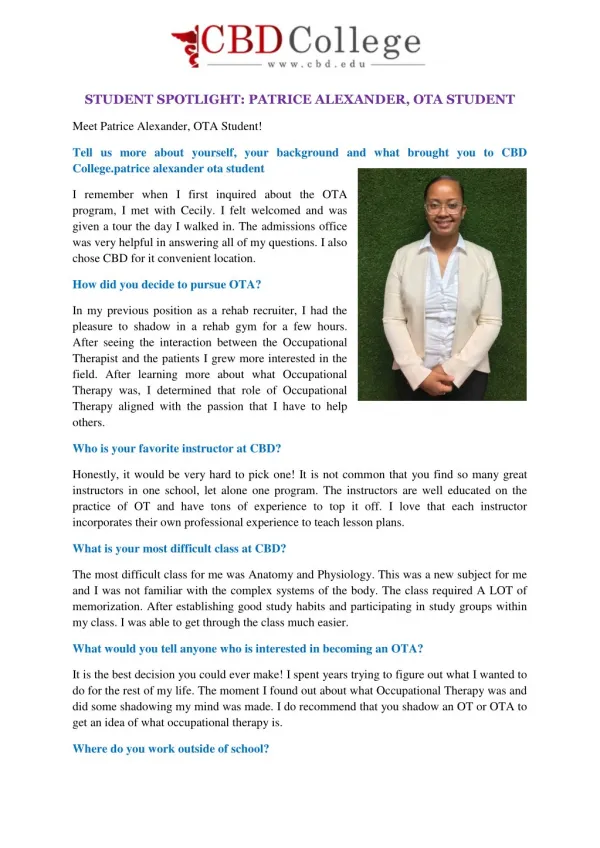
Spotlight on Student Data. What accommodations are used?. What students are using them?. Clip Art by Nvtech. Data Example: State A, 3rd Grade Reading (selected categories). * No scores are reported for groups with fewer than thirty students.

Spotlight on Student Data
E N D
Presentation Transcript
What accommodations are used? What students are using them? Clip Art by Nvtech
Data Example: State A, 3rd Grade Reading (selected categories) * No scores are reported for groups with fewer than thirty students.
Data Example: State C, 3rd Grade Reading Sample of data from public report (also had regular education and special education students by accommodated condition with more score categories across top such as N passing, etc.)
Example: State C, 3rd Grade Reading Percent Tested with Accommodations by Grade and Group 3rd Grade 6th Grade 8th Grade General 1% .7% .6% Education ELL/ LEP 28% 26% 29% Special 52% 74% 81% Education
And now for something completely different… State Data