Note that r is calculated by multiplying the z-scores for each individual’s x - and y -values, adding the products,
Correlation, r , measures the direction and strength of the linear relationship between two quantitative variables. We have ( x, y ) data on n individuals. r = .

Note that r is calculated by multiplying the z-scores for each individual’s x - and y -values, adding the products,
E N D
Presentation Transcript
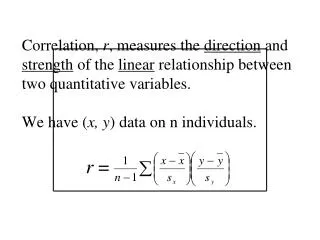
Correlation, r, measures the direction and strength of the linear relationship between two quantitative variables. We have (x, y) data on n individuals.r =
Note that r is calculated by multiplying the z-scores for each individual’s x- and y-values, adding the products, and dividing by n-1.
Properties of Correlation:r makes no distinction between explanatory and response variables. Correlation requires that both variables be quantitative. r does not change if we change the units of measurement. r has no unit of measurement – it is just a number.
r > 0 indicates a positive association; r < 0 indicates a negative association.
Values near 0 indicate a very weak linear relationship. The strength of the linear relationship increases as r moves away from zero and toward – 1 or + 1. – 1 ≤ r ≤ + 1 r = – 1 or + 1 only if all the data points are collinear.
Correlation measures only the strength of a linear relationship between two quantitative variables. Correlation does not describe curved relationships, no matter how strong they may be. ALWAYS visually examine your data!!
Use r with caution when the scatter-plot shows outliers. r is not a resistant measure.
Correlation is not a complete description of two-variable data.When describing 2-variable data, give the values of , sx, and sy in addition to r.
Note that the correlation coefficient only measures the strength of a linear relationship between your variables. It cannot determine causation.A strong linear relationship between two quantities (life expectancy and # people per TV for example) does not guarantee a cause/effect relationship!
Generally, you can NOT conclude that there is a cause/effect relationship until you have run a carefully designed experiment (discussed in chapter 3). This idea is usually written ASSOCIATION ≠ CAUSATION.