Download
1 / 12
120 likes | 267 Views
Broker Version. Regional Watch brazil. International Markets Market Intelligence February 2010. www.lloyds.com/marketintelligence. Disclaimer. brazil: country dashboard. 1500. 30%. 1252. 1178. 1068. 1000. 20%. 500. 10%. 0. 0%. 2006. 2007. 2008. 30. 30%. 18. 15. 20.

E N D
Broker Version Regional Watch brazil International MarketsMarket IntelligenceFebruary 2010 www.lloyds.com/marketintelligence Disclaimer
brazil:country dashboard 1500 30% 1252 1178 1068 1000 20% 500 10% 0 0% 2006 2007 2008 30 30% 18 15 20 20% 13 10 10% 0 0% 2006 2007 2008 click for basic information click for basic information click for detailed information click for detailed information GDP 2008 USD 1,574BN GDP SIZE IN USD BN AND GDP GROWTH OVERVIEW 2008 GDP SIZE: 10th worldwide (UK ranks 6th) EASE OF DOING BUSINESS: 125th worldwide GLOBAL COMPETITIVNESS: N/A STRENGTHS: extensive and varied natural resources, strong manufacturing industry and an attractive market for foreign investors. CHALLENGES: structural reforms slowed by political obstacles, a lack of investment in infrastructure and high public debt. ECONOMY DWP SIZE IN USD BN AND DWP GROWTH OVERVIEW 2008 SIZE: 14th worldwide (UK ranks 3rd) TOP 5 INSURERS: Porto Seguro, Unibanco AIG, Seguradora Lider, Mapfre Vera Cruz, Sul America together control 37% of market share. KEY CLASSES: Motor and Health REINSURANCE: USD 1.95bn (8%) INSURANCE PENETRATION (2008): = 1.6% NON-LIFE DWP* 2008 USD 18BN INSURANCE OVERVIEW 2008 SIZE: 19th for Lloyd’s (UK ranks 2nd) TOP 5 MAs: write 65% of non-life GWP KEY CLASSES: MAT and property REINSURANCE: USD 171m (97%) LLOYD’S MARKET SHARE: = 1.2% STATUS: Lloyd’s does not have a direct licence. Lloyd’s is registered as an ‘admitted’ reinsurer. OFFICE: Type 3, www.lloyds.com/brazil GWP SIZE IN USD MN AND DWP GROWTH NON-LIFE GWP 2008 USD176M LLOYD’S COMPULSORY CLASSES: no information on Lloyd’s crystal REGULATOR OF INSURERS AND INTERMEDIARIES: www.susep.gov.br Insurance in Brazil has to be placed through a broker. At the end of 2009 Brazil counted 17,820 registered broking companies and 19,550 individually registered active brokers in the non-life sector. Top 5 local broking companies are: Harmonia, LAZAM-MDS, OCS, Rodobens and Securitas Uniao Corretora de Seguros. Top international broking companies are: Aon, Guy Carpenter, Willis, JLT. DISTRIBUTION REGULATIONS Northern coastal regions susceptible to floods (high), hailstorms (high) & tornadoes (med). CATASTROPHES Market Intelligence data based on: SUSEP, NATHAN, FENACOR, Lloyd’s Regional Watch, Lloyd’s Exchanging, Global Edge, Swiss RE, IMF, Global Opportunities, CIA world fact book, Exchange rate based on FX History figures. *DWP: Direct Written Premium. ** MAT: Marine, Aviation, Travel. Disclaimer
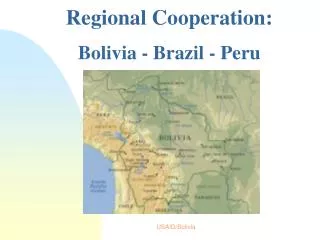
brazil:economy (1 of 2) OIL: PROVEN RESERVES IN BRAZIL IN THOUSAND MN BARRELS 14 12.6 12 10 8 7.4 6 4 2.8 2 0 Back To > Country Dashboard Brazil’s economy fared favourably in the global economic crisis of 2009. Thanks to the resilience of its domestic market and steady foreign demand for its commodities, especially from China, Latin America’s biggest economy shrank only around 0.2% in 2009, compared to an estimated 4% contraction in the EU and 2.5% shrinkage in the US. The region is experiencing a sustained period of strong economic growth, not least through its exposure to the global commodity boom. Political and fiscal instability have eased in recent years, raising the level of interest of foreign investors. THE TUPI OIL FIELD Following announcements in November 2007 of major offshore deep-water discoveries, Brazil will move from being self-sufficient to becoming a net exporter. If the government’s early estimates are confirmed- that the broader area where the recent discoveries were made might hold as much as 70bn -100bn barrels - Brazil will be able to boast of holding among the world’s ten largest oil reserves in the medium to long term. The euphoria sparked by Tupi’s discovery is explained by indications that this field may be a large piece of the major pre-salt layer (oil reservoir found under an extensive layer of salt deep below the sea level) in the Santos basin, which extends from Rio de Janeiro to Santa Catarina. Although drilling in deep water is expensive (estimated costs of between USD 70bn and USD 120bn) and risky, Petrobras- which is the operator of the field and holds a 65% working interest in partnership with the UK’s BG Group (25%) and Portugal’s Galp Energia (10%)- has developed the ‘know how’ technology to be able to carry out this kind of exploration. RISKS Oil prices are currently at historically high levels and could decline substantially by the time commercial production starts, probably around 2012-2013. However, currently the risk is moderate. Another major risk is that the field’s potential falls much short of current expectations. Petrobras’s early estimates of new recoverable reserves of 70bn -100bn barrels may prove exaggerated but there seems to be scope for optimism. The announcement in early January 2008 of the discovery of the Jupiter gas field in the Santos basin, which may be the same size as Tupi, has contributed to further cautious optimism among oil analysts. overview 2008 1988 1998 Source: http://online.wsj.com/article/BT-CO-20100105-710599.html, Economist.com, Euromonitor Archive, www.bp.com Disclaimer
brazil:economy (2 of 2) Back To > Country Dashboard AGRICULTURE Brazil has vast agricultural resources, with two distinct agricultural environments. The first, composed of the southern one-half to two-thirds of the country, has a semi-temperate climate and higher rainfall, the better soils, higher technology and input use, adequate infrastructure, and more experienced farmers. It produces most of Brazil's grains and oil seeds and export crops. The drought-ridden northeast region and in the Amazon basin, lacks well-distributed rainfall, good soil, adequate infrastructure, and sufficient development capital. Although mostly occupied by subsistence farmers, the latter regions are increasingly important as exporters of forest products, cocoa, and tropical fruits. Agriculture accounts for 7% of the country’s GDP and employs about 19% of the labour force. Agribusiness accounts for about one third of Brazil’s GDP. 2009 FACTS > 22% of the world’s arable land> One of the top five producers of fruit: 33 mn tonnes a year> 15.3 mn tonnes of oranges produced annually (1st worldwide) > 1st sugar-cane (367 mn tonnes)> 1st coffee (31.1 mn sacks)> Harvested 50 mn tonnes of soybeans> Beef (7.5+ mn tonnes), poultry (8+ mn tonnes) and pork (2.5+ mn tonnes)> The world’s largest commercial herds, with 172 mn heads of cattle > Brazil is the world's second largest producer of ethanol fuel and the world's largest exporter > In 2008 Brazil produced 24.5 billion litres (6.47 billion U.S. liquid gallons), which represents 37.3% of the world's total ethanol used as fuel. GROWING MIDDLE CLASS Tax cuts and improved credit conditions amid an aggressive easing in monetary policy and the stability of spending power for middle and low income households meant that demand for consumer durables continued through the worst crisis. Consumer incomes have risen across the board, amid stronger growth with low inflation, which has boosted real wages. There has also been increased government support for low-income earners under President Lula da Silva. The result has been a sharp increase in consumption and retail demand. The volume of consumer credit expanded around 30% in 2009. By 2015, 7.5% of Brazilian households are expected to have an annual disposable income over USD15k. Its young population (mean age 29.4 in 2006), makes Brazil one of the most attractive new consumer markets in the world. overview Source: http://www.brazilbrand.com/brazil_industry_import_export_agribusiness.htm Disclaimer
brazil:INSURANCE MARKET (1 of 2) Back To > Country Dashboard NEW BRAZILIAN ENTRANTS Brazil has attracted new entrants into the insurance market for various reasons: the country’s large economy, favourable economic prospects, currently low penetration of primary insurance products, and low natural catastrophe exposure. Entrants also benefit from a well-established industry and clear regulations. Brazilian GDP increased 15% in 2008 from 2005 and SUSEP projects that the Brazilian insurance industry will grow at a compound annual growth rate of almost 10% between now and 2012. BRAZILIAN MARKET PENETRATION The economic reforms introduced by the Brazilian government in the last years, mainly the economic stabilisation plan, as well as the deregulation process, the opening of the market to foreign insurers and the privatisation programme had a profound impact on the insurance market, which in the last few years evolved from a mere participation of 0.8% in the GDP in 1994 to 2.55% in 2006. Considering capitalisation and open private pension schemes, this percentage reached 3.24 %. Nevertheless, low insurance penetration rates somewhat offset the potential that the country’s sizeable economy offers. SUSEPS’s projections indicate growth, but still at a low rate of 3.4% in 2010. These ratios are in line with or in some cases slightly above other Latin American countries, but are still far below those of developed countries. LATIN AMERICA OVERVIEW The Latin American insurance market displays many of the characteristics of emerging markets - most notably that of low insurance penetration. It is a relatively small market compared to its geographical size but demonstrates strong growth potential. . overview Key market players 2009 ((USD m) Source: Clyde and Co, ‘Insurance in Emerging Markets 2009-2010’. SUSEP Disclaimer
brazil:INSURANCE MARKET (2 OF 2) Back To > Country Dashboard NON-LIFE AND LIFE MARKET SIZE (IN BN USD) AND PENETRATION (AS % OF GDP) NON – LIFE LIFE INSURANCE MARKET PENETRATION NON-LIFE PENETRATION LIFE PENETRATION Source: SUSEP Disclaimer
brazil:classes of business SUSEP FORECAST SUSEP FORECAST SUSEP FORECAST SUSEP FORECAST SUSEP FORECAST Back To > Country Dashboard GWP SIZE (USD BN) & GROWTH OVERVIEW Key classes in Brazil are health and motor which account for 73% of the insurance market CLASS OVERVIEW TOTAL MARKET Property represents 13% of total market premiums LLOYD’S Property premiums account for 60% of Lloyd’s GWP in Brazil 6 15% 4.67 4.25 3.86 4 10% 3.54 3.25 PROPERTY 2 5% 0 0% 2008 2009 2010 2011 2012 TOTAL MARKET Liability represents 1% of total market premiums LLOYD’S Liability premiums account for 5% of Lloyd’s GWP in Brazil 0.4 20% 0.34 0.31 0.31 0.28 0.3 15% 0.25 0.2 10% liability 0.1 5% 0.0 0% 2008 2009 2010 2011 2012 TOTAL MARKET MAT represents 6% of total market premiums LLOYD’S MAT premiums account for 11% of Lloyd’s GWP in Brazil 2.5 20% 2.04 1.89 2.0 15% 1.73 1.59 1.50 1.5 10% MAT 1.0 5% 0.5 0.0 0% 2008 2009 2010 2011 2012 TOTAL MARKET Motor represents 42% of total market premiums LLOYD’S Motor accounts for 7% of Lloyd’s GWP in Brazil 13.51 12.74 20% 11.91 11.24 12.0 10.50 15% 8.0 motor 10% 4.0 5% 0.0 0% 2008 2009 2010 2011 2012 TOTAL MARKET Health represents 31% of total market premiums LLOYD’S N/A 11.98 10.79 12.0 20% 9.63 8.60 15% 7.75 8.0 health 10% 4.0 5% 0.0 0% 2008 2009 2010 2011 2012 Source: SUSEP Disclaimer
brazil:reinsurance Other 17% Motor 7% Liability 5% 11% MAT Property 60% Back To > Country Dashboard LIBERALISATION Brazil’s reinsurance sector was given a boost in 2007 after the Brazilian authorities liberalised the reinsurance market and ended the almost 70-year monopoly of the state owned reinsurers IRB Brazil RE. LOCAL, ADMITTED AND OCCASIONAL REINSURERS Complimentary Law 126 issued in January 2007 brought to an end the IRB’s monopoly and provided a new reinsurance framework. Law 126 created three categories of reinsurers- local, admitted and occasional, with local reinsurers (including the IRB) being given the right of first refusal or ‘preferential offer’ of at least 60% of the cedant’s total reinsurance cessions in the first 3 years up to 2010, to be reduced to 40% thereafter. RESOLUTION 168 In December 2007 the CNSP, the Brazilian National Council of Private Insurance, issued implementing Reinsurance Resolutions 168 to 173. Resolution 168 which came into effect on 17 April 2008 is the main resolution and sets out the criteria for registration entry and operation of reinsurers in the new open market. The reinsurance market in Brazil has now been open for competition for nearly two years. At present there are in excess of 70 foreign reinsurers registered in Brazil. overview MAJOR REINSURANCE PLAYERS AS PROPORTION OF TOTAL MARKET 2009 LINES OF BUSINESS NOVEMBER 2009 MAPFRE RE XL RE J MALUCELLI RE ADMITTED AND EVENTUAL REINSURERS TOTAL MARKET MUNICH RE USDm 1,990 LLOYD’S IRB BRAZIL RE The opening of so many new reinsurers in Brazil indicates that there is a positive opinion about the prospects of the local industry. However, considering the small size of the market and the dominance of Brazil Re, it suddenly looks very crowded. In 2008 total reinsurance premiums in the market were (USD) 2.34 bn, and IRB Brazil Re booked (USD)1.92bn, 82% if the total. The biggest obstacle facing new reinsurers is how to compete with IRB Brazil Re. It has been the largest market player for several years and had the advantage of knowing all the local insurers. As a result international players generally tend to ask for more information than local insurers are used to providing. challenges Source: Standard and Poor’s. SUSEP, Clyde and Co, ‘Insurance in Emerging Markets 2009-2010’. Disclaimer
brazil:DISTRIBUTION Back To > Country Dashboard BROKER DOMINANCE Non-life insurance, together with certain employer-based programmes such as group life and accident, and complex life insurance products, is concentrated via intermediary-based markets. Independent brokers serve the personal automobile and small/mid market commercial customer segments in Brazil, and are highly unionised and politically influential. The exceptionally high number of brokers in the country, together with laws that effectively mandate the use of intermediaries, also constitutes a strong collective political influence against direct marketing initiatives. RI BROKERS Before the end of the RI monopoly, brokers were not allowed to intermediate business between insurance companies and IRB Brazil Re. 50% of IRB Brazil’s reinsurance retrocession was, and still is, through brokers. Now there are major opportunities for RI Brokers, to serve both insurance companies and reinsurers established in Brazil. RI Brokers are now allowed to intermediate business within the Brazilian Market as well as abroad. There must be a legal entity, in accordance with the Brazilian Law. RI Brokers can place both reinsurance and retrocession. BROKER SUSPENSIONS AND REINSTATEMENTS As of August 2009, 9 Reinsurance Brokers were temporarily suspended: BSR, Assure International Corretagem de Resseguros Ltda, Inter Aerospace Corretora de Seguros Ltda, Pecus Corretora de Resseguros Ltda, GRB, Cormatt Corretora de Resseguros Ltda, LBS. On 18 November 2008, Susep reinstated Miller do Brasil, UIB Re Brasil, and Securitas Uniao as registered reinsurance brokers after showing proof of their mandatory USD 10m in civil liability coverage. overview Source: http://www.moodys.com.br/brasil Disclaimer
brazil:LLOYD’S position LIABILITY PROPERTY MAT MOTOR MISC Source: Market Intelligence calculations based on Xchanging figures Disclaimer Back To > Country Dashboard CLASS GWP AS % OF TOTAL DWP LLOYD’S GWP SIZE (USD M) AND GROWTH LLOYD’S GWP Growth rate decreased between 2002 and 2003 to become negative over 2004. Since 2005 however, the GWP growth rate has been positive and is on the increase. CAGR since 2002 has been approximately 14%. LLOYD’S CLASSES The chart on the right illustrates how the different classes have been faring within Lloyd’s, as a percentage of total GWP written by Lloyd’s. Lloyd’s key class (MAT) has always contributed the majority of Lloyd’s GWP and has oscillated between 60% and 75% over the last 8 years. Lloyd’s second largest class (property) has instead oscillated between 25% and 40% over the last 8 years. Misc contributed a small proportion to Lloyd’s GWP until 2002, after which it stopped contributing. Since 2006, liability has started contributing (very little) to Lloyd’s GWP. MANAGING AGENTS AND BROKERS Lloyd’s top 10 managing agents accounts for approximately 50% of GWP, whilst Lloyd’s top 10 brokers place approx 88% of Lloyd’s GWP. COVERHOLDERS These are not permitted under the current Brazilian regulation. LLOYD’S OFFICE Lloyd’s office officially opened the new office in April 2009 and already has 6 syndicates. overview
brazil:catastrophes Source: http://mrnathan.munichre.com/ Disclaimer Back To > Country Dashboard BRAZIL: Catastrophes Brazil is less vulnerable to natural hazards than other countries. However, some areas of Brazil are prone to landslides and flash floods and it is among the countries to have recorded the highest number of lightning strikes per year anywhere in the world. FLOODS AND LANDSLIDES The 2009 Brazilian floods and mudslides were a severe natural disaster principally affecting five North-eastern Brazilian states. Heavy rain in Brazil began in early April 2009, affecting 40,000 people.13,000 people were immediately left homeless. As a result of heavy rains, by May, it was being reported that over 300,000 people were homeless and 44 had been killed. Maranhão was the worst affected state. Thirteen of the state's municipalities had declared state of emergency. The Amazon River Basin suffered its second heaviest flood in one hundred years during this period. These were the worst floods Brazil had experienced in over twenty years. Reconstruction from the floods and mudslides are expected to take 3-5 years with potential costs amounting to USD 550m. The October- December floods and landslides in Brazil caused 131 deaths and cost USD 750mn. The most expensive recorded natural catastrophes in Brazil were floods and landslides in 1988 (February) affecting Rio de Janeiro and Acre. It was estimated to have cost USD1bn. EARTHQUAKES There is no history of earthquake in Brazil and, although the risk is considered to be non-existent, there have been occasional tremors in Rio Grande do Norte measuring up to 4.0 on the Richter scale. The region is sparsely populated, however, and has minimal insurance coverage. An earthquake measuring 5.2 on the Richter scale did, however, affect southern Brazil in April 2008, and was widely felt in Sao Paulo, although its epicentre was 170 miles (272 km) off the southern coast. Probably fewer than 10% of all policies have earthquake cover. overview For further information see: http://www.lloyds.com/Lloyds_Market/Tools_and_reference/Exposure_Management/
Disclaimer This document is intended for general information purposes only. Whilst all care has been taken to ensure the accuracy of the information Lloyd's does not accept any responsibility for any errors or omissions. Lloyd's does not accept any responsibility or liability for any loss to any person acting or refraining from action as a result of, but not limited to, any statement, fact, figure, expression of opinion or belief obtained in this document.