Download
1 / 33
330 likes | 514 Views
Oracle and storage IOs, explanations and experience at CERN CHEP 2009 Prague [id. 28]. Eric Grancher eric.grancher@cern.ch CERN IT department. Image courtesy of Forschungszentrum Jülich / Seitenplan , with material from NASA, ESA and AURA/Caltech. Outline. Oracle and IO

E N D
Oracle and storage IOs, explanations and experience at CERNCHEP 2009 Prague [id. 28] Eric Grancher eric.grancher@cern.chCERN IT department Image courtesy of ForschungszentrumJülich / Seitenplan, with material from NASA, ESA and AURA/Caltech
Outline • Oracle and IO • Logical and Physical IO • Instrumentation • IO and Active Session History • Oracle IO and mis-interpretation • IO saturation • CPU saturation • Newer IO devices / sub-systems and Oracle • Exadata • SSD • Conclusions • References 2
PIO versus LIO • Even so memory access is fast compared to disk access, LIO are actually expensive • LIO cost latching and CPU • Tuning using LIO reduction as a reference is advised • The best IO is the IO which is avoided • See “Why You Should Focus on LIOs Instead of PIOs” Carry Millsap 3
Oracle instrumentation • One has to measure “where the PIO are performed” and “how long they take / how many per second are performed” • Oracle instrumentation and counters provide us the necessary information, raw and aggregated t1 t2 t1 t2 t1 t2 Oracle OS IO time 4
Oracle instrumentation • Individual wait events: • 10046 event or EXECUTE DBMS_MONITOR.SESSION_TRACE_ENABLE(83,5, TRUE, FALSE); then EXECUTE DBMS_MONITOR.SESSION_TRACE_DISABLE(83,5); • Trace file contains lines like: WAIT #5: nam='db file sequential read' ela=6784 file#=6 block#=467667 blocks=1 obj#=73442 tim=1490530491532 • Session wait: V$SESSION_WAIT (V$SESSION 10.1+) • Aggregated wait events: • Aggr session: V$SESSION_EVENT • Aggr system-wide: V$SYSTEM_EVENT 5
ASH and IO (1/4) • Using Active Session History • Sampling of session information every 1s • Not biased (just time sampling), so reliable source of information • Obviously not all information is recorded so some might be missed • Can be accessed via • @ashrpt / @ashrpti • V$ACTIVE_SESSION_HISTORY (in memory information) and DBA_HIST_ACTIVE_SESS_HISTORY (persisted on disk) 6
ASH and IO (2/4) • Sample every 1s of every _active sessions_ From Graham Wood (see reference) 7
ASH and IO (3/4) From Graham Wood (see reference) 8
ASH and IO (4/4) SQL> EXECUTE DBMS_MONITOR.SESSION_TRACE_ENABLE(69,17062, TRUE, FALSE); PL/SQL procedure successfully completed. SQL> select to_char(sample_time,'HH24MISS') ts,seq#,p1,p2,time_waited from v$active_session_history where SESSION_ID= 69 and session_serial#=17062 2 and SESSION_STATE = 'WAITING' and event='db file sequential read' and sample_time>sysdate -5/24/3600 3 order by sample_time; TS SEQ# P1 P2 TIME_WAITED ------ ---------- ---------- ---------- ----------- 001557 45565 6 449426 5355 001558 45716 6 17937610118 001559 45862 6 702316 7886 001600 46014 7 91988 5286 001601 46167 7 424665 7594 001602 46288 6 1241840 SQL> EXECUTE DBMS_MONITOR.SESSION_TRACE_DISABLE(69,17062); PL/SQL procedure successfully completed. -bash-3.00$ grep -n 124184 orcl_ora_15854.trc 676:WAIT #2: nam='db file sequential read' ela= 5355 file#=6 block#=449426 blocks=1 obj#=73442 tim=2707602560910 [...] 829:WAIT #2: nam='db file sequential read' ela= 10118file#=6 block#=179376blocks=1 obj#=73442 tim=2707603572300 [...] 977:WAIT #2: nam='db file sequential read' ela= 7886 file#=6 block#=702316 blocks=1 obj#=73442 tim=2707604583489 [...] 1131:WAIT #2: nam='db file sequential read' ela= 5286 file#=7 block#=91988 blocks=1 obj#=73442 tim=2707605593626 [...] 1286:WAIT #2: nam='db file sequential read' ela= 7594 file#=7 block#=424665 blocks=1 obj#=73442 tim=2707606607137 [...] 1409:WAIT #2: nam='db file sequential read' ela= 8861file#=6 block#=124184blocks=1 obj#=73442 tim=2707607617211 9
Cross verification, ASH and 10046 trace (1/2) • How to identify which segments are accessed most often from a given session? (ashrpti can do it as well) • Ultimate information is in a 10046 trace • Extract necessary information, load into t(p1,p2) > grep "db file sequential read" accmeas2_j004_32116.trc | head -2 WAIT #12: nam='db file sequential read' ela= 11175 file#=13 block#=200041 blocks=1 obj#=67575 tim=1193690114589134 WAIT #12: nam='db file sequential read' ela= 9454 file#=6 block#=587915 blocks=1 obj#=67577 tim=1193690114672648 accmeas_2 bdump > grep "db file sequential read" accmeas2_j004_32116.trc | head -2 | awk '{print $9"="$10}' | awk -F= '{print $2","$4}' 13,200041 6,587915 SQL> select distinct e.owner,e.segment_name,e.PARTITION_NAME,(e.bytes/1024/1024) size_MBfrom t, dba_extents e where e.file_id=t.p1 and t.p2 between e.block_id and e.block_id+e.blocks order by e.owner,e.segment_name,e.PARTITION_NAME; 10
Cross verification, ASH and 10046 trace (2/2) • Take information from v$active_session_history create table t as select p1,p2 from v$active_session_history h where h.module like 'DATA_LOAD%' and h.action like 'COLLECT_DN%' and h.event ='db file sequential read' and h.sample_time>sysdate-4/24; SQL> select distinct e.owner,e.segment_name,e.PARTITION_NAME,(e.bytes/1024/1024) size_MBfrom t, dba_extents e where e.file_id=t.p1 and t.p2 between e.block_id and e.block_id+e.blocks order by e.owner,e.segment_name,e.PARTITION_NAME; 11
DStackProf example -bash-3.00$ ./dstackprof.sh 11073 DStackProf v1.02 by Tanel Poder ( http://www.tanelpoder.com ) Sampling pid 11073 for 5 seconds with stack depth of 100 frames... [...] 780 samples with stack below __________________ libc.so.1`_pread skgfqio ksfd_skgfqio ksfd_io ksfdread1 ksfd: support for various kernel associated capabilities kcfrbd manages and coordinates operations on the control file(s) kcbzib kcbgtcrkcb: manages Oracle's buffer cache operation as well as operations used by capabilities such as direct load, has clusters , etc. ktrget2 ktr - kernel transaction read consistency kdsgrpkds: operations on data such as retrieving a row and updating existing row data qetlbr qertbFetchByRowIDqertb - table row source qerjotRowProcqerjo - row source: join kdstf0000001000kmP kdsttgrkds: operations on data such as retrieving a row and updating existing row data qertbFetchqertb - table row source qerjotFetchqerjo - row source: join qergsFetchqergs - group by sort row source opifch2 Kpoal8 / opiodr / ttcpip/ opitsk / opiino / opiodr / opidrv / sou2o / a.out`main / a.out`_start note 175982.1 12
OS level • You can measure (with the least overhead), selecting only the syscalls that you need • For example, pread -bash-3.00$ truss -t pread -Dp 17924 /1: 0.0065pread(258, "06A2\0\001CA9EE1\0 !B886".., 8192, 0x153DC2000) = 8192 /1: 0.0075pread(257, "06A2\0\0018CFEE4\0 !C004".., 8192, 0x19FDC8000) = 8192 /1: 0.0078 pread(258, "06A2\0\001C4CEE9\0 !92AA".., 8192, 0x99DD2000) = 8192 /1: 0.0103 pread(257, "06A2\0\00188 S F\0 !A6C9".., 8192, 0x10A68C000) = 8192 /1: 0.0072 pread(257, "06A2\0\0018E kD7\0 !CFC2".., 8192, 0x1CD7AE000) = 8192 -bash-3.00$ truss -t pread -Dp 15854 2>&1 | awk '{s+=$2; if (NR%1000==0) {print NR " " s " " s/NR}}' 1000 7.6375 0.0076375 2000 15.1071 0.00755355 3000 22.4648 0.00748827 13
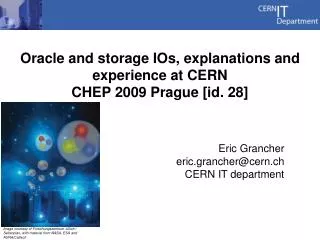
Overload at disk driver / system level (1/2) • Each (spinning) disk is capable of ~ 100 to 300 IO operations per second depending on the speed and controller capabilities • Putting many requests at the same time from the Oracle layer, makes as if IO takes longer to be serviced 14
Overload at disk driver level / system level (2/2) 8*X threads 4*X threads 2*X threads X threads IO operations per second 15
Overload at CPU level • Observed many times: “the storage is slow” (and storage administrators/specialists say “storage is fine / not loaded”) • Typically happens that observed (from Oracle rdbms point of view) IO wait times are long if CPU load is high • Instrumentation / on-off cpu 16
Overload at CPU level, example load growing hit load limit ! Insertion time (ms), has to be less than 1000ms 15k... 30k ... 60k... 90k... 120k ...135k... || 150k (insertions per second) 17
OS level / high-load t1 t2 t1 t2 t1 t2 Oracle OS Acceptable load IO time t1 t2 t1 t2 Oracle OS High load Off cpu IO 18
Overload at CPU level, DTrace • DTrace (Solaris) can be used at OS level to get (detailed) information at OS level syscall::pread:entry /pid == $target && self->traceme == 0 / { self->traceme = 1; self->on = timestamp; self->off= timestamp; self->io_start=timestamp; } syscall::pread:entry /self->traceme == 1 / { self->io_start=timestamp; } syscall::pread:return /self->traceme == 1 / { @avgs["avg_io"] = avg(timestamp-self->io_start); @[tid,"time_io"] = quantize(timestamp-self->io_start); @counts["count_io"] = count(); } 19
DTrace sched:::on-cpu /pid == $target && self->traceme == 1 / { self->on = timestamp; @[tid,"off-cpu"] = quantize(self->on - self->off); @totals["total_cpu_off"] = sum(self->on - self->off); @avgs["avg_cpu_off"] = avg (self->on - self->off); @counts["count_cpu_on"] = count(); } sched:::off-cpu /self->traceme == 1/ { self->off= timestamp; @totals["total_cpu_on"] = sum(self->off - self->on); @avgs["avg_cpu_on"] = avg(self->off - self->on); @[tid,"on-cpu"] = quantize(self->off - self->on); @counts["count_cpu_off"] = count(); } tick-1sec /i++ >= 5/ { exit(0); } 20
DTrace, “normal load” -bash-3.00$ sudo ./cpu.d4 -p 15854 dtrace: script './cpu.d4' matched 7 probes CPU ID FUNCTION:NAME 3 52078 :tick-1sec avg_cpu_on 169114 avg_cpu_off 6768876 avg_io 6850397 [...] 1 off-cpu value ------------- Distribution ------------- count 524288 | 0 1048576 | 2 2097152 |@@@@ 86 4194304 |@@@@@@@@@@@@@@@@@@@@@@@@@@@ 577 8388608 |@@@@@@@@@ 189 16777216 | 2 33554432 | 0 [...] count_cpu_on 856 count_io 856 count_cpu_off 857 total_cpu_on 144931300 total_cpu_off 5794158700 21
DTrace, “high load” -bash-3.00$ sudo ./cpu.d4 -p 15854 dtrace: script './cpu.d4' matched 7 probes CPU ID FUNCTION:NAME 2 52078 :tick-1sec avg_cpu_on 210391 avg_cpu_off 10409057 avg_io 10889597 [...] 1 off-cpu value ------------- Distribution ------------- count 8192 | 0 16384 | 4 32768 |@ 11 65536 | 2 131072 | 0 262144 | 0 524288 | 0 1048576 | 0 2097152 |@ 15 4194304 |@@@@@@@@@@@@@@ 177 8388608 |@@@@@@@@@@@@@@@@@@@@ 249 16777216 |@@@ 41 33554432 | 4 67108864 | 0 [...] count_io 486 count_cpu_on 503 count_cpu_off 504 total_cpu_on 106037500 total_cpu_off 5235756100 22
Exadata (1/2) • Exadata has a number of offload features, most published about are row selection and column selection • Some of our workloads are data insertion intensive, for these the tablespace creation is/can be a problem • Additional load, additional IO head moves, additional bandwidth usage on the connection server→storage • Exadata has file creation offloading • Tested with 4 Exadata cells storage. Tests done with Anton Topurov / ElaGajewska-Dendek 23
Exadata (2/2) Execution time Several tablespace switches Several tablespace switches _cell_fcre=true _cell_fcre=false 25
SSD (1/6) • Solid-State Drive, based on flash, means many different things • Single Level Cell (more expensive, said to be more reliable / faster) / Multiple Level Cell • Competition in the consumer market is shown on the bandwidth... • Tests done thanks to Peter Kelemen / CERN – Linux (some done only by him) 26
SSD (2/6) • Here are results for 5 different types / models • Large variety, even the “single level cell” SSDs • (as expected) The biggest difference is with the writing IO operations per second 27
SSD (3/6) Write IOPS capacity for devices 1/2/3 is between 50 and 120! Write IOPS capacity for devices 1/2/3 is between 50 and 120! 28
SSD (5/6) 30
SSD (6/6) “devices 4 and 5” • “expensive” and “small” (50GB), complex, very promising • For random read small IO operations (8KiB), we measure ~4000 to 5000 IOPS (compare to 26 disks) • For small random write operations (8KiB), we measure 2000 to 3000+ write IOPS (compare to 13 disks) • But for some of the 8K offsets the I/O completion latency is 10× the more common 0.2 ms • “Wear-levelling/erasure block artefacts”? 31
Conclusions • New tools like ASH and DTrace change the way we can track IO operations • Overload in IO and CPU can not be seen from Oracle IO views • Exadata offloading operations can be interesting (and promising) • Flash SSD are coming, a lot of differences between them. Writing is the issue (and is a driving price factor). Not applicable for everything. Not to be used for everything for now (as write cache? Oracle redo logs). They change the way IO operations are perceived. 32
References • Why You Should Focus on LIOs Instead of PIOs Author, Cary Millsap http://www.hotsos.com/e-library/abstract.php?id=7 • TanelPoderDStackProfhttp://tanelpoder.otepad.com/script:dstackprof.sh • Metalink Note 175982.1 • Tanel Poder os_explain.sh http://www.tanelpoder.com/files/scripts/os_explain UKOUG Conference 2009 - 33
Q&A 34