Download
1 / 33
330 likes | 516 Views
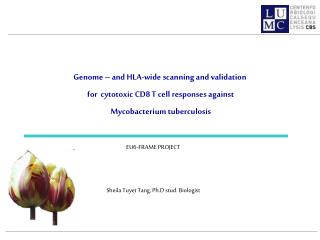
Genome-wide RNAi screens: compute your phenotype. Lígia Brás. Michael Boutros. RNAi experiments in different organisms. C. elegans. Drosophila. Mammals. E. coli. dsRNA. dsRNA. siRNA. T7. > 200bp. > 200bp. 21bp. Injection and soaking. Feeding bacteria. Bathing. Cell culture.

E N D
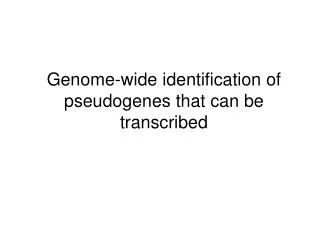
Genome-wide RNAi screens: compute your phenotype Lígia Brás Michael Boutros
RNAi experiments in different organisms C. elegans Drosophila Mammals E. coli dsRNA dsRNA siRNA T7 > 200bp > 200bp 21bp Injection and soaking Feeding bacteria Bathing Cell culture Worms Precursor dsRNA DICER siRNAs Degradation of target message
Screening work flow (I) Preparation of the arrayed 384-well format library High-throughput RNAi screening using various readouts Raw data
Screening work-flow (II) Raw data Computational statistics using bioinformatic tools Gene Ontology Expression DB Protein DB Hit identification cellHTS package Integrate information from external DB Candidates Hit validation by secondary assays
The cellHTS package R/Bioconductor software package (Bioconductor 1.8) http://www.bioconductor.org/packages/bioc/1.8/html/cellHTS.html Analysis of cell-based high-throughput screening (HTS) assays Documentation of cell-based screens and data preprocessing steps Raw data annotated hit list
A typical cell-based HTS assay cellHTS package
The cellHTS package Work flow Import the raw data files Data preprocessing Plate-wise quality control Experiment-wise quality control HTML quality reports Ranking of phenotypes (hit list)
The cellHTS package Main features • per plate quality assessment • Dynamic range; • Scatterplot between replicates and correlation coefficient; • Distribution of the intensity values for each replicate; • “Plate plots” for the replicate measurements and for the standard deviation between replicate measurements • per experiment quality assessment • Boxplots for each replicate grouped by plate; • Distribution of the signal in the control wells • whole screen visualization HTML quality reports
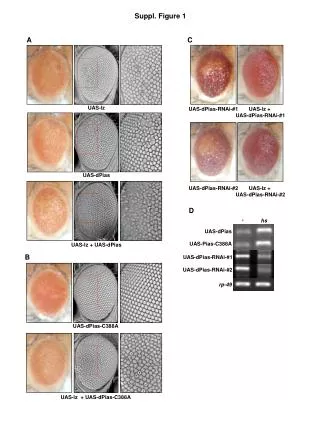
A case study (II) A genome-wide RNAi screen of cell viability in Drosophila melanogaster Kc167 cells • Cells were treated in 384-well plates with 21,306 dsRNAs probes • After 120 hrs, cell viability was measured using an ATP-luminescence readout in a microplate reader • Two replicates were performed for each plate Negative controls Sample wells Positive control Boutros M., Kiger, A. et al. (2004) Genome-wide RNAi analysis of growth and viability in Drosophila cells, Science 303:832-5.
A case study (I) A genome-wide RNAi screen of cell viability in human adenocarcinoma HeLa cells • Dharmacon siARRAY siRNA library which contains pools of 4 different siRNA-sequences targeting one gene • The screen was conducted in microtiter 384-well plate format, and were performed in duplicate • After knockdown of 21,500 target genes for 72 hrs, phenotypic changes were monitored using a luciferase-based assay that quantitatively assesses cell viability Positive controls Sample wells Negative controls Boutros Lab, Signaling and Functional Genomics, DKFZ, Heidelberg, Germany Empty wells
Data preprocessing Remove systematic biases and variations, while keeping the biological relevant information Assay formats, pipetting delivery, robotic failures, differences in compound concentrations due to evaporation of solvent, potency differences across compounds, systematic across-plate biases, within-plate spatial biases, ... • Plate effects (plate-to-plate variations) • Edge or spatial effects within the plate (well-to-well variations)
Data preprocessing Plate effects • Percent of control: • Normalized percent inhibition: • z score: kth well ith plate Plate effects & edge effects rth row cth column ith plate • B score:
Data preprocessing Plate effects • Easy to correct if the assignment of gene-perturbing reagents to the plates was performed in a random manner • Take the plate median as a plate-specific factor, and divide each measurement by the plate median kth well ith plate
Data preprocessing Plate effects – plate median scaling kth well ith plate
Data preprocessing Plate effects • But if the gene-perturbing reagents are not randomly distributed across plates? • Controls • Robust location and scale estimators (mixture of two distributions)
Data preprocessing Plate effects & the siRNA library Dharmacon siARRAY siRNA library contains pools of 4 different siRNA
Plate 25 Plate 26 Plate 27 Data preprocessing Plate effects & the siRNA library
Plate 26 Data preprocessing Plate effects & the siRNA library like-Sm nucleoproteins and ribosomal proteins proteasome subunits or components; ATP/GTP-binding site motifs ribosomal proteins
Data preprocessing Plate effects & the siRNA library • Consider the shorth of the distribution of intensities in each plate as the per-plate scaling factor.
Data preprocessing Edge effects
Ranking of phenotypes Hit list • Score the probes and summarize between replicates to obtain a single score per probe kth well ith replicate • Hit threshold? • a number of standard deviations beyond the mean • percentage of the average control signal • capacity for secondary screening
Follow-up analysis Category analysis for the enrichment of Gene Ontology categories
Follow-up analysis Category analysis for the enrichment of Gene Ontology categories RNA processing, RNA splicing, mRNA metabolism Ribonucleoprotein complex, structural constituent of ribosome cytosolic ribosome Proteasome complex COPI vesicle coating Threonine endopeptidase activity small ribosomal subunit, proteasome complex, spliceosome complex
Follow-up analysis Category analysis for the enrichment of Gene Ontology categories
Follow-up analysis Category analysis for the enrichment of Gene Ontology categories protein biosynthesis macromolecules biosynthesis Ribonucleoprotein complex, structural constituent of ribosome ribosome structural molecular activity Cytosol imaginal disc eversion mRNA processing, mRNA metabolism, translation factor activity Proteasome Large ribosomal subunit Proteasome core complex, Threonine endopeptidase activity
Follow-up analysis Comparison between human and fly orthologs 9 GO categories enriched in both screens: Proteasome complex Ribonucleoprotein complex Ribosome-related mRNA metabolism and processing Threonine endopeptidase activity
Conclusion • cellHTS package: • R/Bioconductor package • Systematic analysis and documentation of cell-based HTS assays by RNAi or other type of perturbation libraries • Step-by-step analysis, from raw data files to the annotated hit list • Useful for multiple screen comparisons • HTS data analysis in general: • Statistical analysis of HTS data is still in a very incipient stage of development • Need of objective benchmarks against which to compare results and help to standardize the hit identification process
Statistical Image Analysis for High-Content Microscopy Screens Experiments by Florian Fuchs from the group of Michael Boutros, DKFZ, HD Dapi Dapi Tubulin Tubulin Phalloidin Phalloidin Dapi Dapi Tubulin Tubulin Phalloidin Phalloidin Experimental data: automated fluorescent microscopy; 3 channels per well; 3 replicates; all genes; more than 80000 images
Customized processing pipeline Generic sharable components Image processing and analysis: Bioconductor package EBImage (ImageMagick & others) dm <- sqrt(distMap(seg)) res <- objectCount(dm, gray[,,4], 100, 40) index x y size intensity [1,] 1 304 95 1065 221.95894 [2,] 1 140 186 680 141.64695 [3,] 1 222 217 786 178.99816 [4,] 1 0 170 274 61.27550 [5,] 1 336 139 800 148.25224 [6,] 1 212 91 696 213.69449 [7,] 1 290 267 664 150.84269 [8,] 1 107 101 1102 245.86509 [9,] 1 257 0 372 83.80994 R Computational statistics on vector data: clustering, classification, hypothesis testing Reproducibility Evolution of code Parallelization Don't reinvent the wheel, stand on the shoulders of giants Phenotypes, gene functions
DR. MICHAEL BOUTROS (group leader) SANDRA STEINBRINK (Ph.D. student) THOMAS HORN (M.sc. student) DR. FLORIAN FUCHS (postdoctoral fellow) DR. DIERK INGELFINGER (postdoctoral fellow) Acknowledgments
Current and future projects Tiling marrays for transcription, DNA-protein binding, genotyping yeast genetics - L. Steinmetz (M. Ritchie, R. Bourgon) heart development in Hs, Mm - S. Sperling, MPI Mol. Genetics (J. Tödling) vulval development in Ce - J. Ahringer, U Cambridge (TBD) Genetic interaction networks from large-scale RNAi experiments image processing - F. Fuchs, M. Boutros, DKFZ (O. Sklyar) numeric data normalization and QA/QC - M. Boutros (L. Bras, F. Hahne) synthetic (buffering) interactions - J. Berger, M. Boutros, R. Gentleman epistatic interactions and pathway inference - A. Kiger (E. Axelsson, R. Bourgon) Funding HFSP, EU, LGC, MRC