Download
1 / 1
10 likes | 170 Views
Environment Canada Meteorological Service of Canada Environnement Canada Service météorologique du Canada. Canadian Centre for Climate Modelling and Analysis Centre canadien de la mod é lisation et de l’analyse climatique. (Model – UARS)/UARS (%). (Model – UARS)/UARS (%).

E N D
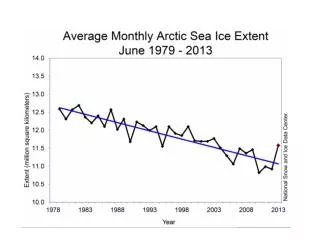
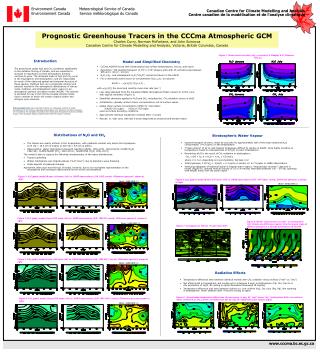
Environment Canada Meteorological Service of Canada Environnement Canada Service météorologique du Canada Canadian Centre for Climate Modelling and Analysis Centre canadien de la modélisation et de l’analyse climatique (Model – UARS)/UARS (%) (Model – UARS)/UARS (%) (Model – UARS)/UARS (%) (Model – UARS)/UARS (%) (Model – UARS)/UARS (%) www.cccma.bc.ec.gc.ca Prognostic Greenhouse Tracers in the CCCma Atmospheric GCM Charles Curry, Norman McFarlane, and John Scinocca Canadian Centre for Climate Modelling and Analysis, Victoria, British Columbia, Canada Figure 1: Zonal mean loss rates, log10a (courtesy S. Beagley & D. Plummer, York U.) Introduction Model and Simplified Chemistry • CCCma AGCM3 forced with climatological sea surface temperatures, sea ice, and ozone • Resolution: T48 spectral transport (3.75º x 3.75º physics grid) with 35 vertical levels between 995 and 1 mb (0 - 49 km) • N2O, CH4 , and stratospheric H2O (“sH2O”) carried as tracers in the AGCM • For a chemically active tracer w/ concentration X(,,z,t), we assume • dX/dt = - a(,z,[t]) X(,,z,t) , • with a(,z,[t]) the zonal and monthly mean loss rate (sec-1) The greenhouse gases N2O and CH4 contribute significantly to the radiative forcing of climate, and are expected to increase in importance as their atmospheric burdens continue to grow. The dominant sinks of N2O and CH4 occur in the troposphere and stratosphere, and are responsible for much of the observed spatial and temporal structure of these species. Outlined here are a prognostic scheme and selected results for the atmospheric distributions of nitrous oxide, methane, and stratospheric water vapour in an atmospheric general circulation model (AGCM). The scheme is intended for use in the CCCma coupled climate model, future versions of which will contain explicit carbon and nitrogen cycle modules. • Loss rates obtained from the Canadian Middle Atmosphere Model (version 5; 2003) runs, with explicit chemistry (Figure 1) • Simplified chemistry applied to N2O and CH4, including the CH4 oxidation source of sH2O • Initialization: globally uniform tracer concentrations, set at surface values • Global mean surface concentration (VMR) for mid-1990s: X(N2O)=310 ppbv; X(CH4)=1730 ppbvused as surface boundary conditions • Approximate chemical equilibrium reached after ~3 years • Results: 11-year runs, with last 8 years diagnosed as seasonal and annual means Acknowledgements: We would like to thank our colleagues involved in model development at the CCCma, especially George Boer, Larry Solheim, and Steve Lambert. CC is funded by the Canadian Foundation for Climate and Atmospheric Sciences (CFCAS) as part of the Canadian Global Coupled Model (CGC3M) research network. Distributions of N2O and CH4 Stratospheric Water Vapour • Upward transport of warm, moist air accounts for approximately half of the mean observed H2O concentration (~4.5 ppmv) in the stratosphere • “Freeze-drying” of air at cold tropical tropopause difficult to resolve in AGCM, since highly sensitive to temperature; leads to underestimate of X(H2O) in lower stratosphere • Remaining sH2O is the result of CH4 oxidation in stratosphere: • CH4 + OH + O2 n H2O + ½ H2 + CO (net), • where n=1.5-2, depending on local chemistry. We take n=2 • Total hydrogen, 2 X(CH4) + X(H2O) = 5-7 ppmv in model, vs. 6-7.5 ppmv in UARS observations • Vertical propagation of seasonal signal in tropical water vapour, “tropical tape recorder” captured in model (Figure 8). Upward vertical velocity of 0.3-0.4 mm/sec estimated between 100 – 50 mb, agreeing with HALOE mean over the same region • The tracers are nearly uniform in the troposphere, with gradients evident only above the tropopause (100 mb = 16.5 km in tropics to 300 mb = 8.5 km at poles) • Observations: Upper Atmosphere Research Satellite (UARS), 1991-2001. Instruments: CLAES (N2O; 1992-93); CLAES/HALOE(CH4; 1991-2001); HALOE/MLS (H2O; 1991-2001) • The model is able to capture the following characteristics of the tracer distributions: • Tropical upwelling • Winter hemisphere sub-tropical plateau (“surf zone”), due to planetary wave breaking • Gross aspects of seasonal changes • Agreement often poor near the top of model, however, due to an incomplete representation of the mesosphere and increased observational errors at low concentrations Figure 2: N2O (ppbv) model (8-year JJA mean; left) vs. UARS observations (JJA, 1992; centre). Difference (percent) shown at right. Figure 6: H2O (ppmv) model (8-year DJF mean; left) vs. UARS observations (DJF, 1991-2001; centre). Difference (percent) is shown at right. Figure 3: N2O (ppbv) model (8-year DJF mean; left) vs. UARS observations (DJF, 1992-93; centre). Difference (percent) shown at right. Figure 7: H2O (ppmv) at 100 mb (7-year mean DJF). Figure 8: Model “tropical tape recorder” in stratospheric H2O. Shown are differences (ppmv) from the 6-year mean at different altitudes in a latitude bin between 5S and 5N. Figure 4: CH4 (ppbv) model (8-year JJA mean; left) vs. UARS observations (JJA, 1992-2001; centre). Difference (percent) shown at right. Radiative Effects • Temperature difference seen between identical models with CH4 oxidation versus without (“wet” vs. “dry”) • Net effect small in troposphere, but cooling up to 3 degrees K seen in stratosphere (Fig. 9a). Due to in situ production of sH2O, IR cooling to space dominates downward IR heating • Temperature difference also seen between uniform vs. non-uniform N2O, CH4 runs (Fig. 9b). Net warming in stratosphere: fewer emitters aloft less IR cooling to space Figure 5: CH4 (ppbv) model (8-year DJF mean; left) vs. UARS observations (DJF, 1991-2001; centre). Difference (percent) shown at right. Figure 9: Annual mean temperature differences (5-year means, in deg. K): “wet” minus “dry” stratosphere (left); non-uniform minus uniform N2O, CH4 (centre); net difference due to fully 3D, radiatively active tracers (right).