Download
1 / 16
160 likes | 557 Views
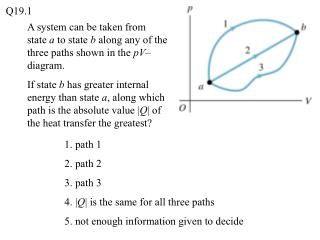
Q19.1. A system can be taken from state a to state b along any of the three paths shown in the pV –diagram. If state b has greater internal energy than state a , along which path is the absolute value | Q | of the heat transfer the greatest?. 1. path 1 2. path 2 3. path 3

E N D
Q19.1 A system can be taken from state a to state b along any of the three paths shown in the pV–diagram. If state b has greater internal energy than state a, along which path is the absolute value |Q| of the heat transfer the greatest? 1. path 1 2. path 2 3. path 3 4. |Q| is the same for all three paths 5. not enough information given to decide
A19.1 A system can be taken from state a to state b along any of the three paths shown in the pV–diagram. If state b has greater internal energy than state a, along which path is the absolute value |Q| of the heat transfer the greatest? 1. path 1 2. path 2 3. path 3 4. |Q| is the same for all three paths 5. not enough information given to decide
Q19.2 A system can be taken from state a to state b along any of the three paths shown in the pV–diagram. If state b has greater internal energy than state a, along which path is there a net flow of heat out of the system? 1. path 1 2. path 2 3. path 3 4. all of paths 1, 2, and 3 5. none of paths 1, 2, or 3
A19.2 A system can be taken from state a to state b along any of the three paths shown in the pV–diagram. If state b has greater internal energy than state a, along which path is there a net flow of heat out of the system? 1. path 1 2. path 2 3. path 3 4. all of paths 1, 2, and 3 5. none of paths 1, 2, or 3
Q19.3 A system is taken around the cycle shown in the pV–diagram, from state a to state b and back to state a in a clockwise direction. For this complete cycle, 1. Q > 0 and W > 0 2. Q > 0 and W < 0 3. Q < 0 and W > 0 4. Q < 0 and W < 0 5. none of the above
A19.3 A system is taken around the cycle shown in the pV–diagram, from state a to state b and back to state a in a clockwise direction. For this complete cycle, 1. Q > 0 and W > 0 2. Q > 0 and W < 0 3. Q < 0 and W > 0 4. Q < 0 and W < 0 5. none of the above
Q19.4 This pV–diagram shows two ways to take a system from state a (at lower left) to state b (at upper right): • via the path acb (in purple), or • via the path adb (in green) Which statement is correct? 1. W > 0 for both path acb and path adb 2. W > 0 for path acb but W < 0 for path adb 3. W < 0 for path acb but W > 0 for path adb 4. W < 0 for both path acb and path adb 5. none of the above
A19.4 This pV–diagram shows two ways to take a system from state a (at lower left) to state b (at upper right): • via the path acb (in purple), or • via the path adb (in green) Which statement is correct? 1. W > 0 for both path acb and path adb 2. W > 0 for path acb but W < 0 for path adb 3. W < 0 for path acb but W > 0 for path adb 4. W < 0 for both path acb and path adb 5. none of the above
Q19.5 In an isothermal expansion of an ideal gas, the amount of heat that flows into the gas 1. is greater than the amount of work done by the gas 2. equals the amount of work done by the gas 3. is less than the amount of work done by the gas, but greater than zero 4. is zero 5. is negative (heat flows out of the gas)
A19.5 In an isothermal expansion of an ideal gas, the amount of heat that flows into the gas 1. is greater than the amount of work done by the gas 2. equals the amount of work done by the gas 3. is less than the amount of work done by the gas, but greater than zero 4. is zero 5. is negative (heat flows out of the gas)
Q19.6 An ideal gas begins in a thermodynamic state a. When the temperature of the gas is raised from T1 to a higher temperature T2 at a constant volume, a positive amount of heat Q12 flows into the gas. If the same gas begins in state a and has its temperature raised from T1 to T2 at a constant pressure, the amount of heat that flows into the gas is 1. greater than Q12 2. equal to Q12 3. less than Q12, but greater than zero 4. zero 5. negative (heat flows out of the system)
A19.6 An ideal gas begins in a thermodynamic state a. When the temperature of the gas is raised from T1 to a higher temperature T2 at a constant volume, a positive amount of heat Q12 flows into the gas. If the same gas begins in state a and has its temperature raised from T1 to T2 at a constant pressure, the amount of heat that flows into the gas is 1. greater than Q12 2. equal to Q12 3. less than Q12, but greater than zero 4. zero 5. negative (heat flows out of the system)
Q19.7 An ideal gas is taken around the cycle shown in this pV–diagram, from a to c to b and back to a. Process ac is at constant pressure, process cb is adiabatic, and process ba is at constant volume. For process cb, 1. Q > 0, W > 0, and DU = 0 2. Q > 0, W > 0, and DU > 0 3. Q = 0, W > 0, and DU < 0 4. Q = 0, W < 0, and DU > 0 5. Q < 0, W > 0, and DU > 0
A19.7 An ideal gas is taken around the cycle shown in this pV–diagram, from a to c to b and back to a. Process ac is at constant pressure, process cb is adiabatic, and process ba is at constant volume. For process cb, 1. Q > 0, W > 0, and DU = 0 2. Q > 0, W > 0, and DU > 0 3. Q = 0, W > 0, and DU < 0 4. Q = 0, W < 0, and DU > 0 5. Q < 0, W > 0, and DU > 0
Q19.8 An ideal gas is taken around the cycle shown in this pV–diagram, from a to c to b and back to a. Process ac is at constant pressure, process cb is adiabatic, and process ba is at constant volume. For process ac, 1. Q > 0, W > 0, and DU = 0 2. Q > 0, W > 0, and DU > 0 3. Q = 0, W > 0, and DU < 0 4. Q = 0, W < 0, and DU > 0 5. Q < 0, W > 0, and DU > 0
A19.8 An ideal gas is taken around the cycle shown in this pV–diagram, from a to c to b and back to a. Process ac is at constant pressure, process cb is adiabatic, and process ba is at constant volume. For process ac, 1. Q > 0, W > 0, and DU = 0 2. Q > 0, W > 0, and DU > 0 3. Q = 0, W > 0, and DU < 0 4. Q = 0, W < 0, and DU > 0 5. Q < 0, W > 0, and DU > 0