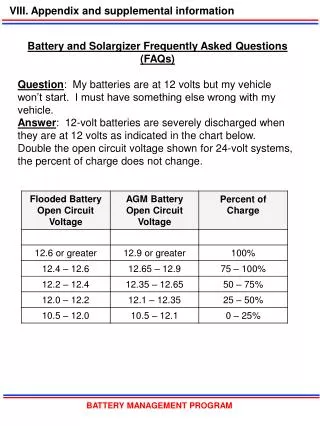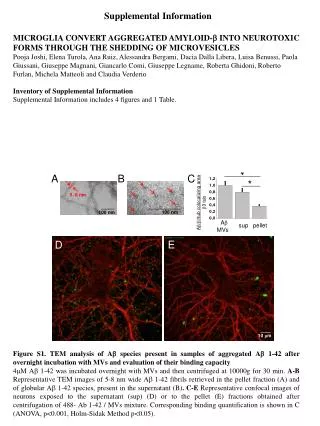
Supplemental Information
What Program Areas And In Which State Regions Do We Need to Grow? Part I Commission on Higher Education Access and Attainment December 10, 2012. Supplemental Information. How We Classify the Educational Levels Needed by Various Occupations Yield Significantly Different Results. 2.


Supplemental Information
E N D
Presentation Transcript
What Program Areas And In Which State Regions Do We Need to Grow? Part I Commission on Higher Education Access and Attainment December 10, 2012 Supplemental Information
How We Classify the Educational Levels Needed by Various Occupations Yield Significantly Different Results 2 SOURCE: Florida data is from the Dept. of Economic Opportunity; National data is from Bureau of Labor Statistics – see link.
Florida, July 2012 (Seasonally Adjusted) Total Employment by Industry Sector 3
Jobs in Industry Sectors Requiring a Master’s or Higher Degree
Workforce Demandby Occupational Groups (for all education levels) 5
CIP Codes Explained The CIP taxonomy is organized on three levels: 1) the two-digit series, 2) the four-digit series, and 3) the six-digit series. The two-digit series represent the most general groupings of related programs. The four-digit series represent intermediate groupings of programs that have comparable content and objectives. The six-digit series, also referred to as six digit CIP Codes, represent specific instructional programs. Postsecondary educational institutions use six-digit CIP codes when completing the IPEDS Completions Survey. EXAMPLE: 51-0000 Health Professions and Related Programs 51-1200 Medicine 51-1201 Medicine (Medical School) 51.1400 Medical Clinical Sciences/Graduate Medical Studies 51-1401 Medical Scientist
SOC Codes Explained Standard Occupational Classification and Coding Structure The occupations in the SOC are classified at four levels of aggregation to suit the needs of various data users: major group, minor group, broad occupation, and detailed occupation. Each lower level of detail identifies a more specific group of occupations. The 23 major groups, are divided into 97 minor groups, 461 broad occupations, and 840 detailed occupations. EXAMPLE: 29-0000 Healthcare Practitioners and Technical Occupations 29-1000 Health Diagnosing and Treating Practitioners 29-1060 Physicians and Surgeons 29-1062 Family and General Practitioners
Methodological Considerations 8 • 1) Preparation: Increasing some of the most challenge and high-demand degrees is not possible because too few qualified students are prepared for those programs • 2) Co-ordination: There are 40 public, 31 ICUF (independent non-profit), and 114 CIE (independent, or-profit) institutions, as well as non-Florida on-line degree awarding institutions, that supply graduates to meet Florida employer demands. • 3) Timing: Any new additional bachelors, masters & advanced degree-holders targeted in 2013 will complete their degrees no sooner than 2015 or later. • 4) Costs: Many of the bachelors, masters and advanced degrees that are most in demand because of scarce faculty, high program costs and low tuition levels. • 5) Exportation: Florida currently exports many degree-holders to graduate schools never to return and to jobs in other states & countries. • 6) Immigration: Degree-holders from outside Florida and America will continue to be recruited, transferred and move to Florida as the employment grows notwithstanding demand/supply efforts. • 7) History: Past projections of huge demand for teachers early last decade evaporated before the end of the decade. • 8) Digital Learning Degrees: In state and out-state on-line degree programs must also be incorporated into any Demand/Supply “Gap” analysis, particularly when addressing regional demand.
Florida’s Supply / Demand Web Portal The Supply/Demand Web Portal Encompasses Workforce, Education, Labor Market Information, and Current Job Ads All Users will be able to View and Benefit from: • Current online job ads as an indicator of occupational demand by region and statewide • Pipeline of education and training enrollees and recent completers/graduates by occupation • Contrast of supply to demand to see where occupational shortages exist