Financial Barriers in Higher Education: Consequences and Recommendations for Affordability
This article discusses the financial barriers faced by low-income students in accessing and persisting in higher education. It highlights the inequities between low and high-income students and proposes recommendations for restoring college affordability. The article also provides data on graduation rates and enrollment breakdown for low-income students.


Financial Barriers in Higher Education: Consequences and Recommendations for Affordability
E N D
Presentation Transcript
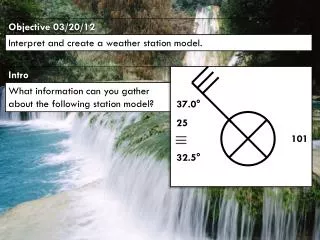
Financial Barriers to Opportunity for Higher Education Socioeconomic Diversity Alliance University of Chicago January 18, 2016 Tom Mortenson Senior Scholar The Pell Institute for the Study of Opportunity in Higher Education Intro
Financial Barriers Education Pipeline Family Income Financial Barriers Consequences Restoring college affordability
Financial Barriers Education Pipeline Bottleneck in Higher Education Financial Barriers Consequences Proposals
Overview of 6-year Graduation Rates for Entire Population of Low-income Students Enrollment & Graduation Breakdown of the Bottom Income Quartile under Age 24 While the college persistence gap is smaller than the access gap for low income students, there is far greater inequity between low and high income students who enroll in college. 100% COLLEGE ACCESS GAP (55% of total) 72% % of Low Income < 24 Population 61% Enrollment Rate of HS Graduates 72% HS Grad Rate 18% 6-yr Bachelor’s Grad Rate of Enrolled Students 45% COLLEGE PERSISTENCE GAP (37% of total) 8% % of Total With a Bachelor’s Degree % of Total Enrolled in College % of Total Graduated from HS Total Population Source: Postsecondary Opportunity – postsecondary.org Note: The 18% 6 year graduation rate of enrolled students in the bottom quartile includes students who attend Community College
Financial Barriers Education Pipeline Family Income Financial Barriers Consequences Restoring college affordability
Financial Barriers Education Pipeline Family Income Financial Barriers Consequences Restoring college affordability
Financial Need Analysis Model Cost of Attendance Tuition and fees Room and board Books and supplies Personal and medical care Transportation Less: Expected family contribution Income and assets Family size Number of children enrolled in college Equals: Financial need Gift aid: grants, scholarships, waivers Earnings from work/study Education loans: subsidized/unsubsidized Stafford, PLUS Federal tax credits
Financial Barriers Education Pipeline Family Income Financial Barriers Consequences Restoring college affordability
Financial Barriers Education Pipeline Family Income Financial Barriers Consequences Restoring college affordability
Restoring College Affordability:Recommendations for Reauthorizationof the Higher Education Act $13,000 Pell Grant maximum award $2000 Super Pell Grant Federal-State partnership for financing Pell Grant program College Work-Study for all students Income contingent education loan repayment Admissions lottery for class-selective Title IV institutions Rigorous evaluation of all financial aid programs for effectiveness