
Uploaded by
odysseus-marks
1 SLIDES
127 VIEWS
10LIKES
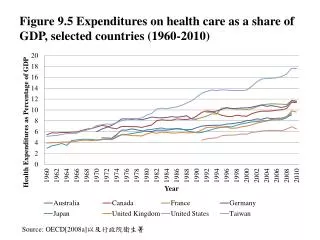
Trends in Health Care Expenditures as a Share of GDP in Selected Countries (1960-2010)
DESCRIPTION
This figure illustrates the trends in health care expenditures as a percentage of Gross Domestic Product (GDP) for various countries from 1960 to 2010. Data is sourced from the OECD and the Ministry of Health and Welfare in Taiwan. The graph highlights disparities in health care spending and reflects the changing priorities and economic conditions affecting health policies among these nations. Understanding these trends is crucial for policymakers and health economists in assessing the effectiveness of health investments relative to economic growth.
Download
1 / 1
Download Presentation 
Trends in Health Care Expenditures as a Share of GDP in Selected Countries (1960-2010)
An Image/Link below is provided (as is) to download presentation
Download Policy: Content on the Website is provided to you AS IS for your information and personal use and may not be sold / licensed / shared on other websites without getting consent from its author.
Content is provided to you AS IS for your information and personal use only.
Download presentation by click this link.
While downloading, if for some reason you are not able to download a presentation, the publisher may have deleted the file from their server.
During download, if you can't get a presentation, the file might be deleted by the publisher.
E N D
Presentation Transcript
Figure 9.5 Expenditures on health care as a share of GDP, selected countries (1960-2010) Source: OECD[2008a]以及行政院衛生署


More Related