Download
1 / 45
450 likes | 562 Views
Explore network measures, graph properties, connected components, paths, small-world networks, and more for understanding complex interactions within networks. Discover the significance of hubs, hierarchical organization, and scale-free networks.

E N D
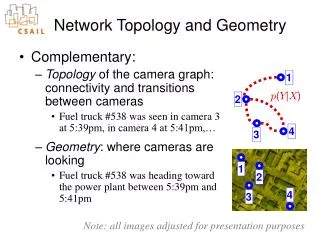
Network Example - The Internet http://www.jeffkennedyassociates.com:16080/connections/concept/image.html
Co-authorship at Max Planck http://www.jeffkennedyassociates.com:16080/connections/concept/image.html
Network Measures • Degree ki • Degree distribution P(k) • Mean path length • Network Diameter • Clustering Coefficient
Network Analysis Paths: metabolic, signaling pathways Cliques: protein complexes Hubs: regulatory modules Subgraphs: maximally weighted
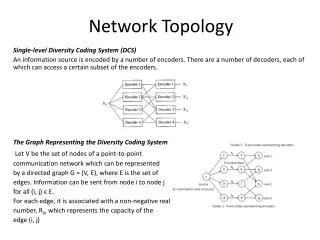
Graphs • Graph G=(V,E) is a set of vertices V and edges E • A subgraph G’ of G is induced by some V’V and E’ E • Graph properties: • Connectivity (node degree, paths) • Cyclic vs. acyclic • Directed vs. undirected
Sparse vs Dense • G(V, E) where |V|=n, |E|=m the number of vertices and edges • Graph is sparse if m~n • Graph is dense if m~n2 • Complete graph when m=n2
Connected Components • G(V,E) • |V| = 69 • |E| = 71
Connected Components • G(V,E) • |V| = 69 • |E| = 71 • 6 connected components
Paths A path is a sequence {x1, x2,…, xn} such that (x1,x2), (x2,x3), …, (xn-1,xn) are edges of the graph. A closed path xn=x1 on a graph is called a graph cycle or circuit.
Small-world Network • Every node can be reached from every other by a small number of hops or steps • High clustering coefficient and low mean-shortest path length • Random graphs don’t necessarily have high clustering coefficients • Social networks, the Internet, and biological networks all exhibit small-world network characteristics
Network Representation regulates regulatory interactions (protein-DNA) gene B gene A binds functional complex B is a substrate of A (protein-protein) gene B gene A reaction product is a substrate for metabolic pathways gene B gene A
Degree Distribution P(k) is probability of each degree k, i.e fraction of nodes having that degree. For random networks, P(k) is normally distributed. For real networks the distribution is often a power-law: P(k) ~ k-g Such networks are said to be scale-free
Clustering Coefficient The density of the network surrounding node I, characterized as the number of triangles through I. Related to network modularity k: neighbors of I nI: edges between node I’s neighbors The center node has 8 (grey) neighbors There are 4 edges between the neighbors C = 2*4 /(8*(8-1)) = 8/56 = 1/7
Target the hubs to have an efficient safe sex education campaign Lewin Bo, et al., Sex i Sverige; Om sexuallivet i Sverige 1996, Folkhälsoinstitutet, 1998
Scale-Free Networks are Robust • Complex systems (cell, internet, social networks), are resilient to component failure • Network topology plays an important role in this robustness • Even if ~80% of nodes fail, the remaining ~20% still maintain network connectivity • Attack vulnerability if hubs are selectively targeted • In yeast, only ~20% of proteins are lethal when deleted, and are 5 times more likely to have degree k>15 than k<5.
Other Interesting Features • Cellular networks are assortative, hubs tend not to interact directly with other hubs. • Hubs tend to be “older” proteins (so far claimed for protein-protein interaction networks only) • Hubs also seem to have more evolutionary pressure—their protein sequences are more conserved than average between species (shown in yeast vs. worm) • Experimentally determined protein complexes tend to contain solely essential or non-essential proteins—further evidence for modularity.
Summary: Network Measures • Degree ki The number of edges involving node i • Degree distribution P(k) The probability (frequency) of nodes of degree k • Mean path length The avg. shortest path between all node pairs • Network Diameter • i.e. the longest shortest path • Clustering Coefficient • A high CC is found for modules
Identifying protein complexes in protein-protein interaction networks
Identifying protein complexes from protein-protein interaction data require computational tools. Identifying protein complexes from PPI data Barabasi & Oltvai, Nature Reviews, 2004
The three steps of MCODE Vertex weighting Complex prediction Post-processing The MCODE algorithm Molecular Complex Detection MCODE
Vertex (nodes) weighting Vertex weighting Find neighbors
K-core graph: A graph of minimal degree k, i.e. All nodes must have at least k connections Vertex (nodes) weighting Vertex weighting Find neighbors Get highest k-core graph
Density: Number of observed edges, E, divided by the total number of possible edges, Emax Emax = V (V-1)/2 (networks without loops) Vertex (nodes) weighting Vertex weighting Find neighbors Get highest k-core graph Calculate density of k-core graph
Density: Number of observed edges, E, divided by the total number of possible edges, Emax Emax = V (V-1)/2 (networks without loops) Vertex (nodes) weighting Vertex weighting Find neighbors Get highest k-core graph Calculate density of k-core graph Calculate vertex (node) weight: Density * kmax
Molecular complex prediction Complex prediction Seed complex by nodes with highest weight Include neighbors if the vertex weight is above threshold (VWP) Repeat step 2 until no more nodes can be included
Post-processing Complex post-processing Complexes must contain at least a 2-core graph Include neighbors if the vertex weight is above the fluff parameter (optional) Haircut: Remove nodes with a degree less than two (optional)
Active Subgraphs Find high scoring subnetwork based on data integration Ideker T, Ozier O, Schwikowski B, Siegel AF. Discovering regulatory and signaling circuits in molecular interaction networks.Bioinformatics. 2002;18 Suppl 1:S233-40.
Scoring a Sub-graph Ideker T, Ozier O, Schwikowski B, Siegel AF. Discovering regulatory and signaling circuits in molecular interaction networks. Bioinformatics. 2002;18 Suppl 1:S233-40.
Significance Assessment of Active Module Score distributions for the 1st - 5th best scoring modules before (blue) and after (red) randomizing Z-scores (“states”). Randomization disrupts correlation between gene expression and network location. Ideker T, Ozier O, Schwikowski B, Siegel AF. Discovering regulatory and signalling circuits in molecular interaction networks. Bioinformatics. 2002;18 Suppl 1:S233-40.
Finding “Active” Pathways in a Large Network is Hard • Finding the highest scoring subnetwork is NP hard, so we use heuristic search algorithms to identify a collection of high-scoring subnetworks (local optima) • Simulated annealing and/or greedy search starting from an initial subnetwork “seed” • Considerations: Local topology, sub-network score significance (is score higher than would be expected at random?), multiple states (conditions)
Summary • Network measures • degree, network diameter, degree distributions, clustering coefficient • Network modularity and robustness from hubs • Analyzing networks • Finding motifs, identifying modules (complexes) • Data integration • Finding active subnetworks