Download
1 / 25
250 likes | 343 Views
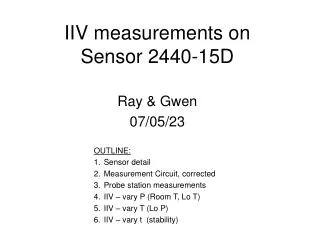
IIV measurements on Sensor 2440-15D. Ray & Gwen 07/05/23. OUTLINE: Sensor detail Measurement Circuit, corrected Probe station measurements IIV – vary P (Room T, Lo T) IIV – vary T (Lo P) IIV – vary t (stability). Reminder : Liverpool data on 2440-15D. Connections in the vacuum system.

E N D
IIV measurements on Sensor 2440-15D Ray & Gwen 07/05/23 • OUTLINE: • Sensor detail • Measurement Circuit, corrected • Probe station measurements • IIV – vary P (Room T, Lo T) • IIV – vary T (Lo P) • IIV – vary t (stability)
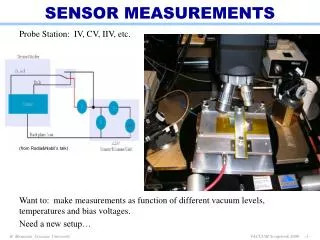
Connections in the vacuum system Was triax-to-coax adapter here – Not true anymore: now triax-to-banana
Q. When is a short not a short? ADAPTER: TRIAX -to- COAX A. When it is this thing – this adapter added a “diode”-like short behavior above 150 V. (Why?)
Comparison of Bulk Currents (linear)
RT vary P IIV @ 21.4C – varying P • 4.3e-5 mbar • 6.2e-5 mbar • 1.1e-4 mbar • 3.3e-4 mbar • 6.6e-4 mbar • 9.9e-4 mbar • 3.4e-3 mbar • 6.7e-3 mbar • 8.9e-3 mbar Bulk Current Guard Ring Current All points are averages over 5 msrmts per point Pressure variation under +/- 0.1, temp variation under 0.2 C max-min each dataset
RT vary P IIV @ 21.4C (zoom: bulk) • 4.3e-5 mbar • 6.2e-5 mbar • 1.1e-4 mbar • 3.3e-4 mbar • 6.6e-4 mbar • 9.9e-4 mbar • 3.4e-3 mbar • 6.7e-3 mbar • 8.9e-3 mbar
RT vary P IIV @ 21.4C (zoom: guard ring) • 4.3e-5 mbar • 6.2e-5 mbar • 1.1e-4 mbar • 3.3e-4 mbar • 6.6e-4 mbar • 9.9e-4 mbar • 3.4e-3 mbar • 6.7e-3 mbar • 8.9e-3 mbar (?)
RT vary P Current vs Pressure @ 100 V “diode region” No overall trend, but maybe small enhancement? T very stable around 21.35 C, DT under 0.2 C max-min for each dataset
RT vary P Current vs Pressure @ 300 V “ohmic region” No overall trend, but maybe small enhancement? T very stable around 21.35 C, DT under 0.2 C max-min for each dataset
Lo T vary P IIV @ -9.5C – varying P • 3.4e-5 mbar, -9.47C • 1.1e-4 mbar, -9.49C • 3.0e-4 mbar, -9.44C • 6.5e-4 mbar, -9.43C • 1.0e-3 mbar, -9.50C • 3.2e-3 mbar, -9.48C • 6.5e-3 mbar, -9.57C • 9.2e-3 mbar, -9.48C Bulk Current Guard Ring Current All points are averages over 5 msrmts per point Pressure variation under +/- 0.1, temp variation under 0.5 C max-min each dataset
Lo T vary P IIV @ -9.5C (zoom) • 3.4e-5 mbar, -9.47C • 1.1e-4 mbar, -9.49C • 3.0e-4 mbar, -9.44C • 6.5e-4 mbar, -9.43C • 1.0e-3 mbar, -9.50C • 3.2e-3 mbar, -9.48C • 6.5e-3 mbar, -9.57C • 9.2e-3 mbar, -9.48C
Lo T vary P Current vs Pressure @ 100 V “diode region” Trend? T very stable around -9.5 C, DT under 0.5 C max-min for each dataset
Lo T vary P Current vs Pressure @ 300 V “ohmic region” Trend? T very stable around -9.5 C, DT under 0.5 C max-min for each dataset
vary T Lo P IIV @ 3e-5 mbar – varying T 16 runs shown here – adiabatic temp rise (7 sequential plus ½ h delay remainder)
vary T Lo P Current vs Temperature @ 100 V “diode region” Should be: factor ~2 for 10 C See: factor ~2 for 30 C Plus: kink ! (?)
vary T Lo P Current vs Temperature @ 300 V “ohmic region” See: factor ~1.4 for 30 C Plus: kink (?)
RT Lo P Stability @ 3e-5 mbar & 21.4C 16 runs shown here – taken with ½ h delay between
RT Lo P Stability @ 3e-5 mbar & 21.4C @ 300V “ohmic region” 8 hr
RT Med P Stability @ 1e-3 mbar & 21.4C 20 runs shown here – taken with ½ h delay between
RT Med P Stability @ 1.0e-3 mbar & 21.4C @ 300V “ohmic region” 10 hr
Next • IV with floating guard ring in the probe station (for comparison with L’Pool DB) • CV for this sensor… • Next sensor : 2440-09E • Then: pick a p-type