Download

1 / 27
270 likes | 423 Views
Second GPS Radio Occultation Data Users Workshop, 22-24 August, 2005 National Conference Center, Lansdowne, Virginia. Assimilation of GPS RO Data for Severe Weather Prediction In the Vicinity of Taiwan. 1 Ching-Yuang Huang

E N D
Second GPS Radio Occultation Data Users Workshop, 22-24 August, 2005National Conference Center, Lansdowne, Virginia Assimilation of GPS RO Data for Severe Weather Prediction In the Vicinity of Taiwan 1Ching-Yuang Huang 1Department of Atmospheric Sciences, National Central University, Taiwan Collaborators: 2Ying-Hwa Kuo, 1Shu-Ya Chen, 1Jei-Zu Wang and 2Yong-Run Guo 2National Center for Atmospheric Research, Boulder, USA Sponsored by NSPO
Case simulations with GPS RO data: 2001- Typhoon Lekima 2001- Typhoon Nari (2001/09) 2002- Typhoon Nakri (2002/07) 2002- Typhoon Sinlaku (2002/08) 2003- Dujuan Typhoon (2003/08/31/12-09/02/00) 2004- Cold front-1 (2004/02/06/18) 2004- Cold front-2 (2004/02/07/06) 2004- President’s-day front (2004/05/19/12-22/12) 2004- Typhoon Conson (2004/06/07/00-09/00) 2004- Typhoon Mindulle (2004/06/29/06-07/02/06) 2004- Typhoon Aere (2004/08/21/18-25/12) 2004- Typhoon Namadol (2004/12/02-04) 2004- Cold front(2004/12/03 or 06) 2005- Early-March snow event (cold front) WRF 2005- Typhoon Haitang (2005/07/17) WRF 2005- Typhoon Matsa (2005/08/05)* WRF
6 LEO satellites provide 2500 global daily measurements. • It will offer up to about 50~100 soundings in a regional model domain for a 6-h assimilation time window.
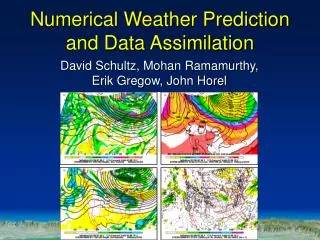
The model simulations use three nested domains at 45-, 15- and 5-km resolutions. All the simulations use MM5 version 3.5 or 3.6 with explicit treatments (Goddard’s scheme) for ice/graupel physics in the three domains (1, 2 and 3), Anthes Kuo’s scheme and Grell’s scheme for cumulus parameterization in domain 1 (largest) and domain 2, respectively, and the Blackadar scheme for PBL parameterization in all the domains. 3DVAR was performed for each domain with GPSrf. Model Domain and Physics
MM5/WRF 3DVAR Cost function defined by x:N-component vector of the analysis variable, xb:N-component vector of the background variable (first guess) yobs: M-component vector of the observations, B:Forecast-error covariance matrix(N ×N), O:Observational covariance matrix(M ×M), h: Transformation operator (converts analysis to observation), N: Number of degrees of freedom in analysis, M: Number of observations.
Covariance Matrix- O • The GPS radio occultation observational covariance matrix is diagonal and thus has assumed no vertical correlations. • This assumption of vertical un-correlation is certainly not supportive of some existing dependence between observations, but in absence of statistical information on those correlations, the assumption insures that the data information is not underestimated in assimilation. • The diagonal elements (variances) are prescribed as a profile exponentially decreasing from 3 N at 100 hPa to 10 N at 1000 hPa. The value of 10 N observational error near the surface is slightly than, but consistent with, the 3% refractivity difference between CHAMP radio-occultations and ECMWF analysis found at 1000 hPa, as reported by Kuo et al. (2004).
A: the number of the grids on which both forecast and observation exceed the threshold, F: the number of the grids on which forecast exceeds the threshold, and O: the number of the grids on which observation exceeds the threshold. > 1,500 verification grid points on the island. Threat Score (TS)
Threat Scores (Huang et al., 2005, Weather and Forecasting, August) • TS is generally higher for the run with assimilated QuikSCAT data.
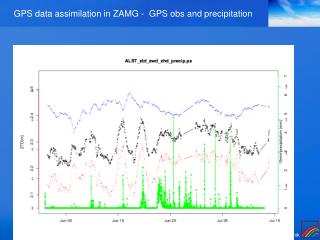
Table. Threat scores (TS) and root mean square errors (RMSE) (mm) of the accumulated rainfalls between 0-24 h and 24-48 h for different thresholds for the Lekima (2001) and Sinlaku (2002) simulations with and without GPS refractivity data. (Huang, 2003, NSPO project report) Thresholds
DUJUAN SIMULATION WITH GPSrf Episode : 31/08/2003-02/09/2003 MM5 Version 3.6 with MRF PBL and K-F cumulus parameterization Initial time (1200UTC 31 August) ± 3 hr
Observed rainfall for (a) 00-1200UTC 1 September 2003 (max: 166.806 mm), (b) 12-2400UTC 1 September 2003 (max: 657.744 mm). 。
GTS only 09/01/00-12UTC 09/01/12-24UTC 69.3 mm 369 mm
BOTH (GTS + GPSrf) 09/01/00-12UTC 09/01/12-24UTC 81.4 mm 387 mm
Dujuan Simulation N: No-3DVAR B: Both (GTS+GPSrf) G: GTS only +: Best track (CWB)
2004/07 Mindulle Typhoon initial time 2004/06/29/0600UTC a b MM5 simulated near-surface pressure (mb) and wind (ms-1) at 24h,36h, 48h,60h. 36h 24h No GPSrf No GPSrf c d 48h No GPSrf No GPSrf 60h
2004/07 Mindulle Typhoon initial time 2004/06/29/0600UTC a b MM5 simulated near-surface pressure (mb) and wind (ms-1) at 24h,36h, 48h,60h. 24h 36h With GPSrf With GPSrf c d With GPSrf 48h With GPSrf 60h
MM5 simulated 24-h accumulated rainfall (mm) 2004/07 Mindulle Second day First day First day Obs. a b No GPSrf No GPSrf 0600UTC 29-30 June 2004 (max value: 76.5 mm) Second day d c With GPSrf With GPSrf 0600UTC 30 June -1 July 2004 (max value: 320.5 mm) initial time 2004/06/29/0600UTC
2004/12 Nanmadol Typhoon Initial time:2004/12/02/1800UTC a b MM5 simulated near-surface pressure (mb) and wind (ms-1) at 30h,36h, 30h No GPSrf No GPSrf 36h c d With GPSrf 30h With GPSrf 36h
2004/12 Nanmadol Typhoon MM5 simulated 24-h accumulated rainfall (mm) a b No GPSrf With GPSrf (a) max value: 561mm(b) max value: 554mm。 1200UTC 3-4 December 2004 (max value: 528.9mm)
Haitang Simulation ongoing with WRF… 2~4 GPSrf Episode : 07/17/2005-07/19/2005
The simulated results indicate the impact of several GPS refractivity data is only marginally positive for some severe weathers in the vicinity of Taiwan. More positive impact may be procured by combinations with other unconventional data. Much more data from COSMIC can be assimilated and might be very helpful for improving weather prediction in Taiwan. Conclusions
(From Sokolovskiy et al. 2004) local operator Nonlocal operator Refractivity mapping WRF 3DVAR with local and nonlocal operators by 2006.
Errors increase considerably near upper boundary, due to the less cancellation effects in a shorter path. Thus, local refractivity operator may still be recommended above the tropopause. The refractivity mapping normally has even larger errors compared to errors for excess phases, due to the application of Abel inversion in a finite domain with non-negligible local refractivity. The straightline forward operator is very fast and the assimilation will fit computationally into real-time operations. Comments on Nonlocal Refractivity OperatorAssimilation
End. 2005/01/01 Taipei 101