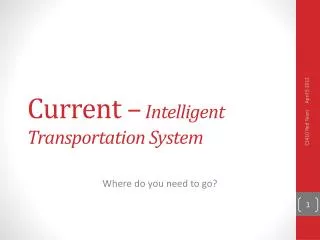
Current – Intelligent Transportation System
Current – Intelligent Transportation System . Where do you need to go?. Outline. 3 Team Introduction 4 Problem Statement 5-10 Background Research 11 Process Flows (Pre Solution) 12 Solution 13 Process Flows (Post Solution) 14 Objectives

Current – Intelligent Transportation System
E N D
Presentation Transcript
Current – Intelligent Transportation System CS410 Red Team Where do you need to go?
Outline • 3 Team Introduction • 4 Problem Statement • 5-10 Background Research • 11 Process Flows (Pre Solution) • 12 Solution • 13 Process Flows (Post Solution) • 14 Objectives • 15-18 Market Analysis • 19 What’sIn The Box • 20 What’sNot In The Box • 21 Major Functional Component • 22-27 Hardware Overview • 28-31 Hardware Milestones • 32-39 Software Overview • 40-42 User Interface Overview • 43-49 Software Milestones • 50-52 Database Schemas • 53-56 Gantt Charts • 57-59 Project Budget & Cost • 60-64 Project Risks • 65 Conclusion • 67 References CS410 Red Team
Introduction: Our Team Nathan Lutz - Project Manager - Hardware Specialist Akeem Edwards - Financial Specialist - Software Specialist Chris Coykendall - Web Developer - Software Specialist Dean Maye - Documentation - Database Admin • Brian Dunn • Marketing Specialist • Web Developer CS410 Red Team Kevin Studevant - Database Admin • CJ Deaver • Risk Analyst • Hardware Specialist Domain Expert Kamlesh Chowdary ITS Engineer at HRT Domain Expert Dr. Tamer Nadeem Mobile Apps at ODU Mentor Dave Farrell Systems Engineer at MITRE Corp.
Introduction: The Problem Lack of complete information prevents transit organizations and local businesses from maximizing the potential benefits of light rail systems. CS410 Red Team
Background: Increased Sales Due to increased accessibility and an influx of new customers, local businesses in light rail service areas see increased sales: • A study in Dallas showed a 33% increase in retail sales of businesses near the DART starter line.1 • Near Norfolk’s Tide light rail station on Newtown Road, a 7-Eleven owner reported a 13-14% increase in sales.2 • In Salt Lake City, a restaurant owner reported annual increases of 25-30% due to their proximity to the TRAX light rail.3 • In Phoenix, one business owner reported a 30% increase in revenue since the local light rails opening.4 CS410 Red Team However, these systems do not maximize this potential by working with local businesses and providing information to riders. • http://www.detroittransit.org/cms.php?pageid=26 • http://hamptonroads.com/2012/02/some-stores-near-norfolk-light-rail-stations-see-boost • http://www.gulfcoastinstitute.org/university/LightRail_BusinessImpact.pdf • http://www.friendsoftransit.org/The-Businesses-of-Light-Rail.pdf
Background: Increased Sales Due to increased accessibility and an influx of new customers, local businesses in light rail service areas see increased sales: • A study in Dallas showed a 33% increase in retail sales of businesses near the DART starter line.1 • Near Norfolk’s Tide light rail station on Newtown Road, a 7-Eleven owner reported a 13-14% increase in sales.2 • In Salt Lake City, a restaurant owner reported annual increases of 25-30% due to their proximity to the TRAX light rail.3 • In Phoenix, one business owner reported a 30% increase in revenue since the local light rails opening.4 However, these systems do not maximize this potential by working with local businesses and providing information to riders. CS410 Red Team • http://www.detroittransit.org/cms.php?pageid=26 • http://hamptonroads.com/2012/02/some-stores-near-norfolk-light-rail-stations-see-boost • http://www.gulfcoastinstitute.org/university/LightRail_BusinessImpact.pdf • http://www.friendsoftransit.org/The-Businesses-of-Light-Rail.pdf
Background: Jobs & Development Over the past five years, studies have shown light rail systems as an effective stimulant for new development and jobs: • In Charlotte, over $291 million in new development was seen along their new 10-mile line with another $1.6 billion expected.1 • The Maryland Transit Administration estimated 27,000 new jobs per year over the next 30 years attributed to their new Purple Line.2 If light rail usage is maximized, then the potential for further expansion can boost these numbers even further. CS410 Red Team Dallas LRT Projected Spending vs. Impact3 • http://www.detroittransit.org/cms.php?pageid=26 • http://washingtonexaminer.com/local/maryland/2011/11/purple-line-expected-be-major-economic-engine-md-officials-say • http://www.dart.org/about/WeinsteinClowerTODNov07.pdf
Background: Jobs & Development Over the past five years, studies have shown light rail systems as an effective stimulant for new development and jobs: • In Charlotte, over $291 million in new development was seen along their new 10-mile line with another $1.6 billion expected.1 • The Maryland Transit Administration estimated 27,000 new jobs per year over the next 30 years attributed to their new Purple Line.2 If light rail usage is maximized, then the potential for further expansion can boost these numbers even further. CS410 Red Team Dallas LRT Projected Spending vs. Impact3 • http://www.detroittransit.org/cms.php?pageid=26 • http://washingtonexaminer.com/local/maryland/2011/11/purple-line-expected-be-major-economic-engine-md-officials-say • http://www.dart.org/about/WeinsteinClowerTODNov07.pdf
Background: Tide Case Study A survey of over 1000 Norfolk residents was taken and although 90% were aware of new light rail, many lacked other information: • About 70% of downtown workers did not know the stop locations. • About 55% of other respondents did not know the stop locations. • 69% of respondents ranked information about stops as an important problem. • 75% of respondents ranked schedule information as an important problem. CS410 Red Team http://www.gohrt.com/publications/reports/sir-light-rail-summary.pdf
The Tide ridership started strong, breaking the first-year 2,900 daily rider estimate in its opening months, but has been in decline since.1 Background: Tide Ridership CS410 Red Team http://www.gohrt.com/public-records/Commission-Documents/Commission-Meetings/FY2012/January-2012.pdf
Process Flow pre-Current ITS Static ridership data Set schedule, stops/stations and fare for light rail, and determine new service areas Need to evaluate & expand Tide light rail services Light rail normal operation Receive user feedback about service through traditional means Local Business Owners -Visit website -Get schedule information -Get fare info -Get stop info -Purchase e-ticket Ride to next stop Go to stop/station Need to go somewhere Embark CS410 Red Team Disembark Tide Rider Traditional advertising media (print, radio, TV) Want to attract Light Rail customers No big returns on tax payer investment in light rail Inefficient marketing
The Solution CurrentIntelligent Transportation System (ITS) Current will provide accessible, real-time, and accurate information to transit authorities for maximizing adoption and expansion of emerging light rail public transportation systems. CS410 Red Team
Process Flow with Current ITS Historical data & event data Quickly & accurately set schedule, stops/stations and fare for light rail Need to evaluate & expand Tide light rail services Real-time ridership + GPS data Efficient light rail operation Send alerts & receive user feedback about service through Current ITS Current ITS provides all info needed by rider Ride to next stop Need to go somewhere Go to stop/station CS410 Red Team Embark Tide Rider Disembark Advertising with Current ITS Realize returns on tax payer investment in light rail Want to attract light rail customers Effectively target market Local Business Owners
Objectives • Cooperation with local businesses through targeted advertising and listing will directly contribute to local economic growth. • Direct, two-way communication with riders will allow operators to deliver important information and collect feedback from riders. • Provide transit authorities and local businesses with analysis and reports showing detailed information about riders and their habits. • Provide real-time updates on train locations, seat availability, service interruptions, local events, and important announcements. • Provide easily accessible static information to riders regarding schedules, stop locations, and local businesses. • Multiple mediums (mobile apps, station kiosks, and websites) will be used for information and communication to ensure easy access. CS410 Red Team
Current Trend Analysis • Current ITS provides detailed information regarding light rail usage. This data can be sorted to highlight different stops, special events, and time of day trending. • Current ITS will not provide automatic rerouting or boost capacity in itself, but will provide operators the necessary information to make these decisions. • As an example, Norfolk’s Grand Illumination Parade generated 3x the normal average daily ridership, but HRT provided no additional capacity.1 CS410 Red Team Average Daily Boarding 2 http://www.gohrt.com/public-records/Operations-Documents/Rail/Monthly-Ridership/Rail-Ridership-Current.pdf Debbie Messina, “The Tide.” The Virginian-Pilot. February 18th, 2012.
Local Businesses • Previous research showed how much impact light rail stops can have on local businesses, but riders still lack information about them. • Through a GUI allowing users to easily find local businesses and attractions, riders will be more likely to explore and rely on the system for recreational usage. • In addition, the business owner backend will allow local businesses to advertise companies through Current ITS. CS410 Red Team
Target Market • As traffic, gas prices, and pollution rise, light rails are quickly catching on as a more efficient means of transportation.1 • As the result of Obama investing $8 Billion in stimulus funding for rail transit, even more projects are now under development and expansion.1 • New light rail development and expansion costs millions to taxpayers who demand quick results for their money.2 CS410 Red Team Light Rail Project Costs http://www.cbsnews.com/8301-503544_162-4949672-503544.html http://www.lightrail.com/projects.htm
Market Outlook Initial Target: • The Tide (Hampton Roads Transit) US Market: • 35 light rail systems currently active and running1 • 60 more systems in development or proposal stages2 Global Market: • Almost 8000 miles of light rail track in Europe alone3 • Light rails are used throughout the world from South America to the Philippines Future: • Global light rail market estimated at $7.5 Billion by 2015 and is rapidly growing.3 CS410 Red Team http://apta.com/resources/statistics/Documents/Ridership/2011-q3-ridership-APTA.pdf http://www.lightrailnow.org/success2.htm http://www.prweb.com/releases/light_rail/light_rail_transit/prweb4253534.htm
In The Box A service to set up and maintain: • Web Application Engine • Prediction Server/ Decision Engine • Embedded Linux Transmission Application • Android Application • Real-Time Train Tracking (GPS) • Real-Time Passenger Counting (APC) Algorithms • To provide customized reports and forecast data • Backend to provide location based business advertisements CS410 Red Team
Not In The Box • Trains • Tracking System for Buses • Real-time Rerouting • Text message alerts (future feature) • QR Code Ticketing (future feature) • Social media integration (future feature) • Total transit management integration (future feature) CS410 Red Team
Major Functional Component Diagram Decision Engine Web App Server DB GTFS CS410 Red Team GPS Transponder Onboard Unit Infrared Counters
Train Hardware Option 1 GPS Antenna Person Counter USB to PC Serial to PC Onboard Computer with 3G Modem CS410 Red Team Transit IT site GSM to Application Server
Train Hardware Option 2 GPS Tracker Person Counter GSM Output Serial to PC Onboard Computer with 3G Modem CS410 Red Team Transit IT site GSM to Application Server
Train Hardware Costs Option 1 Option 2 CS410 Red Team * Per train
IT Department Hardware Operation System: Red Hat® Enterprise Linux Host Server: Dell R710 Virtualization Host: Red Hat ® Enterprise Virtualization CS410 Red Team * Unlimited Virtual Machines
Station HardwareOptional Next train is at 3:30 Transit IT site CS410 Red Team
Station HardwareOptional CS410 Red Team * Per station
Hardware Milestones Hardware Onboard Hardware Production Servers Development CS410 Red Team
Hardware Milestones Hardware Onboard Hardware Production Servers Development Workstations CS410 Red Team Dev Servers Dev Phone
Hardware Milestones Hardware Onboard Hardware Production Servers Development WAE Server CS410 Red Team DB Server
Hardware Milestones Hardware Onboard Hardware Production Servers Development People Counting Sensors CS410 Red Team GPS Sensors Embedded PC
Software Provided Web Application Engine • Monitoring Report System • Capacity/Trend Forecasting • Rider Web Interface Optimization/Prediction Server Embedded Linux Transmission Application Android Application CS410 Red Team
Software Overview LEVEL I LEVEL II LEVEL III LEVEL IV (ASYNCHRONOUS) Google API GPS DatabaseServer Optimization and Prediction Server Intranet On-boardModule Wireless SensorNetwork Web ApplicationEngine CS410 Red Team APC Internet Station Display Smart Devices Desktop On-BoardPassengerDisplay
Level I – Embedded System Single Board Linux Master PCwith GSM communications. GPS Light Rail Vehicle APC CS410 Red Team SQL Server Database Intranet GSM Network
Level II - Prediction • Real-time ridership and GPS coordinates of the vehicles will be retrieved from database, along with historical ridership data. • This data will be analyzed based upon various features of time, riders, waypoints and other trends. • The prediction server will generate and save a forecast to a database, as well as option routes in the event of a failure MySQL Database Server CS410 Red Team Decision Engine & Web AppsServer
Decision Engine (DE) Request Algorithms WAE Request Received SQL Database Poll Interval Reached Predictiontype? Request new historical data Capacity Delay Associate ridership/time/locations with actual reported incidents Retrieve ridership forecast table Retrieve delay forecast table CS410 Red Team Generate new training sets and save to forecast tables Apply batch gradient descent learning algorithm w/ client position vector Reset poll clock Return forecast result to WAE
Intelligent Routing Algorithm Route Request from WAE Establish network of nodes (train cars, stations, busses) Associate beginning point with nearest node SQL Database Associate endpoint with nearest node Assign weights to nodes CS410 Red Team Poll DB for changes Poll DB for moving entities that intersect path Determine fitness of path comparing weights of potential paths Apply constraints (schedules, capacity, alerts) Use network to determine shortest path Update weighted network Advise route
Level III - Reporting • The Web Application Engine (WAE) transmits the monitoring results from the Decision Engine to the Google API using General Transit Feed Specification (GTFS). • Simultaneously, the WAE checks with the Google API to update its record of local destinations at the station waypoints from Google Places. CS410 Red Team Internet Decision Engine Web ApplicationEngine
Level IV - Presentation • With the WAE in place and extensible interface to it, any web-enabled device can then retrieve the monitoring and local destination results directly using a standard format (GTFS, AJAX, etc.) • The WAE will also receive rider feedback input from the end-user devices (website , Android app, etc.) Results will be written to a database for trend data and accessible via a back-end monitoring interface. • Ideally, the real-time passenger information (RTPI) will be available at every point possible to the end-user. CS410 Red Team Web ApplicationEngine Internet
Mobile App GUI Sitemap Splash Screen User Login Feedback Submission Form Main Menu& Alerts App Settings (Menu) Local Events Browse Attractions Ticket Purchasing Trip Planning CS410 Red Team Starred Events Google Maps Overlay Upcoming Event Calendar Plan Trip w/ Destination Rail Vehicle Vacancy & Delays Rail Stop List Map Google Driving Directions
HRT GUI Mockups CS410 Red Team
Business GUI Mockups CS410 Red Team
Software Milestones Software Server Software Mobile/Kiosk App Embedded Apps CS410 Red Team
Software Milestones Embedded Apps Linux Reporting Agent Serial Interface WAN Database I/O CS410 Red Team GPS Vehicle Position Ridership Data APC Ridership Count
Software Milestones Software Server Software Mobile/Kiosk App Embedded Apps Database CS410 Red Team Decision Engine Web Application Engine
Software Milestones Database Server Configure Server Configure DBMS Access Control Install OS Disk Layout Design Schemas CS410 Red Team Networking Tables Fields Firewall Keys Backups Constraints Install DBMS
Software Milestones Decision Engine Database I/O Request Handler Gradient Descent / Supervised LearningAlgorithm Option Route Detection CS410 Red Team Forecast Tables Delay Forecast Rider Features Shortest Path Historical Features Shortest Time Ridership Forecast Optional Routes GTFS Interface Location Features
Software Milestones Web Application Engine Database I/O Web GUI General Request Handler Syndication Process Administrative Interface Capacity Check Google Places API Checker Rider Feedback CS410 Red Team Schedule Delays GTFS/AJAX/Etc Publication Retrieve Schedule Rail Capacity & Delay Forecast Accept Feedback Rider Feedback Module Local Destinations Ridership Counts Retrieve Forecast Local Event Calendar
Software Milestones Mobile/Kiosk Application Local Database GUI Processes GUI Setting Shared Preferences Schedule Delays UI Event Handler CS410 Red Team GPS/Triangulation Checker Rail Capacity & Delay Forecast Rider Feedback Module WAE Requester (Interface) Ridership Counts Rider Feedback Submission Local Places Local Event Calendar
Database Schemas CS410 Red Team