Understanding Cardio-Respiratory Dynamics: Responses to Exercise and Performance Limitations
470 likes | 597 Views
This outline explores the interplay between ventilation and cardiovascular dynamics during exercise. Key topics include cardio-respiratory adaptations to training, VO2max, the importance of heart rate and stroke volume, and the role of anaerobic and ventilatory responses at various intensity levels. It discusses how blood flow is redistributed during physical activity to prioritize oxygen delivery to active tissues while maintaining brain and heart perfusion. The influence of training on these responses and the factors limiting cardio-respiratory performance are also examined.

Understanding Cardio-Respiratory Dynamics: Responses to Exercise and Performance Limitations
E N D
Presentation Transcript
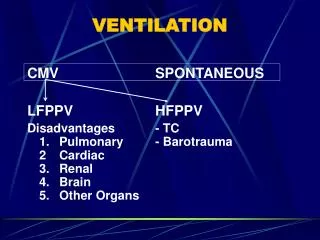
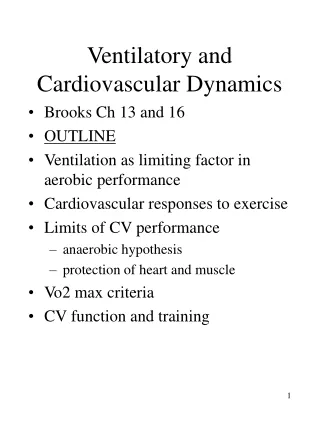
Ventilation and Cardiovascular Dynamics Brooks Ch 13 and 16
Outline • Cardio-Respiratory responses to exercise • VO2max • Anaerobic hypothesis • Noakes protection hypothesis • Limits of Cardio-Respiratory performance • Is Ventilation a limiting factor in VO2max or aerobic performance? • Cardio-respiratory adaptations to training
Cardio-Respiratory Responses to Exercise • Increase Respiratory Rate and Depth • Increase blood flow to active areas • decrease blood flow to less critical areas • Principle CV responses • Inc Cardiac Output - Q = HR * SV • Inc Skin blood flow • dec flow to viscera and liver • vasoconstriction in spleen • maintain brain blood flow • inc coronary blood flow • inc muscle blood flow
Cardio-Respiratory System Rest vs Maximal Exercise Table 16.1(untrained vs trained) RestMax Ex UT T UT T HR(bpm) 70 63 185 182 SV (ml/beat) 72 80 90 105 (a-v)O2(vol%)5.6 5.6 16.2 16.5 Q(L/min) 5 5 16.6 19.1 VO2 ml/kg/min 3.7 3.7 35.8 42 SBP(mmHg) 120 114 200 200 Vent(L/min) 10.2 10.3 129 145 Ms BF(A)ml/min 600 555 13760 16220 CorBFml/min 260 250 900 940
Oxygen Consumption • Cardiovascular Determinants • rate of O2 transport • amount of O2 extracted • O2 carrying capacity of blood • VO2 = Q * (a-v)O2 • Exercise of increasing intensity
Ventilatory Response • Fig 12-15 - linear increase in ventilation with intensity to about 50-65% VO2 max - then non linear • With training, ventilatory inflection point shifts to right (delay)
Oxygen Consumption • Exercise of increasing intensity • Fig 16-2,3,4 • Q and (a-v)O2 increases equally important at low intensities • high intensity HR more important • (a-v)O2 - depends on capacity of mitochondria to use O2 - rate of diffusion - blood flow • O2 carrying capacity - influenced by Hb content
Heart Rate • Most important factor in responding to acute demand • inc with intensity due to Sympathetic stimulation and withdrawal of Parasympathetic • estimated Max HR 220-age (+/- 12) • influenced by anxiety, dehydration, temperature, altitude, digestion • Steady state - leveling off of heart rate to match oxygen requirement of exercise (+/- 5bpm) • Takes longer as intensity of exercise increases, may not occur at very high intensities • Cardiovascular drift - heart rate increases steadily during prolonged exercise due to decreased stroke volume
Heart Rate • HR response : • Is higher with upper body - at same power requirement • Due to : smaller muscle mass, increased intra-thoracic pressure, less effective muscle pump • Is lower in strength training • Inc with ms mass used • Inc with percentage of MVC (maximum voluntary contraction) • estimate the workload on heart , myocardial oxygen consumption, with • Rate Pressure Produce - RPP • HR X Systolic BP
Stroke volume • Stroke Volume - volume of blood per heart beat • Rest - 70 - 80 ml • Max - 80-175 ml • Fig 16-2 - increases with intensity to ~ 25-50% max - levels off • inc EDV (end diastolic volume) • high HR may dec ventricular filling • athletes have high Q due to high SV • supine exercise - • SV does not increase - starts high • SV has major impact on Q when comparing athletes with sedentary • ~ same max HR - double the SV and Q for athletes
(a-v)O2 difference • Difference between arterial and venous oxygen content across a capillary bed • (ml O2/dl blood -units of %volume also used) (dl = 100ml) • Difference increases with intensity • fig 16-4 - rest 5.6 - max 16 (vol %) (ml/100ml) • always some oxygenated blood returning to heart - non active tissue • (a-v) O2 can approach 100% extraction of in maximally working muscle • 20 vol %
Blood Pressure • Blood Pressure fig 16-5 • BP = Q * peripheral resistance (TPR) • dec TPR with exercise to 1/3 resting • Q rises from 5 to 25 L/min • systolic BP goes up steadily • MAP - mean arterial pressure • 1/3 (systolic-diastolic) + diastolic • diastolic relatively constant • Rise of diastolic over 110 mmHg - associated with CAD
Cardiovascular Triage • With exercise - blood is redistributed from inactive to active tissue beds - priority for brain and heart maintained • sympathetic stimulation increases with intensity • Causes general vasoconstriction • brain and heart are spared vasoconstriction • Active hyperemia - directs blood to working muscle - adenosine, Nitric oxide - vasodilators
Cardiovascular Triage • maintenance of BP priority • Near maximum, working ms vasculature can be constricted • protective mechanism to maintain flow to heart and CNS • May limit exercise intensity so max Q can be achieved without resorting to anaerobic metabolism in the heart • Eg - easier breathing - inc flow to working ms • harder breathing - dec flow to working ms • Eg - one leg exercise - muscle blood flow is high • Two leg exercise - muscle blood flow is lower • To maintain BP, vasoconstriction overrides the local chemical signals in the active muscle for vasodilation
Cardiovascular Triage • Eg. Altitude study fig 16-6 - observe a reduction in maximum HR and Q with altitude even though we know a higher value is possible - illustrates protection is in effect
Coronary blood flow • Large capacity for increase • (260-900ml/min) • due to metabolic regulation • flow occurs mainly during diastole • Increase is proportional to Q • warm up - facilitates increase in coronary circulation
VO2max • Maximal rate at which individual can consume oxygen - ml/kg/min or L/min • long thought to be best measure of CV capacity and endurance performance • Fig 16-7
VO2 max • Criteria for identifying if actual VO2 max has been reached • Exercise uses minimum 50% of ms mass • Results are independent of motivation or skill • Assessed under standard conditions • Perceived exhaustion (RPE) • R of at least 1.1 • Blood lactate of 8mM (rest ~.5mM) • Peak HR near predicted max
What limits VO2 max ? • Traditional Anaerobic hypothesis for VO2max • After max point - anaerobic metabolism is needed to continue exercise - plateau (fig 16-7) • max Q and anaerobic metabolism will limit VO2 max • this determines fitness and performance • Tim Noakes,Phd - South Africa (1998) • Protection hypothesis for VO2max • CV regulation and muscle recruitment are regulated by neural and chemical control mechanisms • prevent damage to heart, CNS and muscle • regulate force and power output and controlling tissue blood flow • Still very controversial - not accepted by most scholars
Inconsistencies in Anaerobic hypothesis • Q dependant upon and determined by coronary blood flow • Max Q implies cardiac fatigue - ischemia -? Angina pectoris? • this does not occur in most subjects • Blood transfusion and O2 breathing • inc performance - many says this indicates Q limitation • But still no plateau • was it a Q limitation? • altitude - observe decrease in Q (fig 16-6) • Yet we know it has greater capacity • This is indicative of a protective mechanism
Practical Aspects of Noakes Hypothesis • regulatory mechanisms of Cardio Respiratory and Neuromuscular systems facilitate intense exercise • until it perceives risk of ischemic injury • Then prevents muscle from over working and potentially damaging these tissues • Therefore, improve fitness / performance by; • muscle power output capacity • substrate utilization • thermoregulatory capacity • reducing work of breathing • These changes will reduce load on heart • And allow more intense exercise before protection is instigated • CV system will also develop with training
VO2 max versus Endurance Performance • Endurance performance - ability to perform in endurance events (10km, marathon, triathlon) • General population -VO2 max will predict endurance performance - due to large range in values • elite -ability of VO2 to predict performance is not as accurate - athletes all have values of 65-70 + ml/kg/min • world record holders for marathon • male 69 ml/kg/min female 73 ml/kg/min - VO2 max • male ~15 min faster with similar VO2max • Observe separation of concepts of VO2max / performance • Lower VO2 max for cycling compared to running • Running performance can improve without an increase in VO2 max • Inc VO2 max through running does not improve swimming performance
VO2 max versus Endurance Performance • other factors that impact endurance performance • Maximal sustained speed (peak treadmill velocity) • ability to continue at high % of maximal capacity • lactate clearance capacity • performance economy • Thermoregulatory capacity • high cross bridge cycling rate • muscle respiratory adaptations • mitochondrial volume, oxidative enzyme capacity
VO2 max versus Endurance Performance • Relationship between Max O2 consumption and upper limit for aerobic metabolism is important 1. VO2 max limited by O2 transport • Q and Arterial content of O2 2. Endurance performance limited by Respiratory capacity of muscle (mitochondria and enzyme content) • Evidence • anemic blood replaced with healthy blood containing red blood cells • immediately raises Hb - and restores VO2 max to 90% of pre anemic levels • running endurance was not improved
VO2 max versus Endurance Performance • Davies - CH 6 - Correlation's • VO2 and Endurance Capacity .74 • Muscle Respiratory capacity and Running endurance.92 • Training results in 100% increase in muscle mitochondria and 100 % inc in running endurance • Only 15% increase in VO2 max • VO2 changes more persistent with detraining than respiratory capacity of muscle • Again illustrating independence of VO2 max and endurance
VO2 max versus Endurance Performance • Second Davies study - iron deficiency • Fig 33-10 restoration of dietary iron • hematocrit and VO2 max responded rapidly and in parallel • muscle mitochondria and running endurance - improved more slowly, and in parallel
Is Ventilation a limiting Factor to performance? • Ventilation (VE) does not limit sea level aerobic performance • capacity to increase ventilation is greater than that to inc Q • Ventilation perfusion Ratio - VE/Q • VE rest 5 L/min - exercise 190 L/min • Fig 13-2 • Q rest 5L/min - ex 25 L/min • VO2/Q ratio ~ .2 at rest and max • VE/Q ratio • ~1 at rest - inc 5-6 fold to max exercise • Capacity to inc VE much greater
Ventilation as a limiting Factor to performance? • Ventilatory Equivalent VE/VO2 • Fig 12-15 - linear increase in vent with intensity to ventilatory threshold - then non linear • VE rest 5 L/min - exercise 190 L/min • VO2 .25 L/min - exercise 5 L/min • VE/ VO2 : rest 20 (5/.25) ; max 35(190/5)
Ventilation as a limiting Factor to performance? • MVV - maximum voluntary ventilatory capacity • 1. VE max often less than MVV • 2. PAO2(alveolar) and PaO2 (arterial) • Fig 11-4 , 12-12 • maintain PAO2 - or rises • PaO2 also well maintained
Ventilation as a limiting Factor to performance? • 3. Alveolar surface area - is very large • 4. Fatigue of Vent musculature • MVV tests - reduce rate at end of test • repeat trials - shows decreased performance • Yes, fatigue is possible in these muscles - is it relevant -NO • VE does not reach MVV during exercise, so fatigue less likely • Further, athletes post exhaustive exercise can still raise VE to MVV, illustrating reserve capacity for ventilation
Elite Athletes • Fig 13-3 - observe decline in PaO2 with maximal exercise in some elite athletes
Elite Athletes • may see ventilatory response blunted, even with decrease in PaO2 • may be due to economy • extremely high pulmonary flow, inc cost of breathing, any extra O2 used to maintain this cost • ? Rise in PAO2 - was pulmonary vent a limitation, or is it diffusion due to very high Q ? • Altitude • experienced climbers - breathe more - maintain Pa O2 when climbing • Elite - may be more susceptible to impairments at altitude
Changes in CV with Training • Tables 16-1,2 - training impacts • Heart - inc ability to pump blood-SV - inc end diastolic volume-EDV • Endurance training • small inc in ventricular mass • triggered by volume load • resistance training • pressure load - larger inc in heart mass • adaptation is specific to form • swimming improves swimming • Interval training - repeated short to medium duration bouts • improve speed and CV functioning • combine with over-distance training
Cardiovascular Adaptations with Endurance TrainingTable 16.2 RestSubmax ExMax Ex (absolute) HR 0 SV (a-v)O2 0 Q 0 0 VO2 0 0 SBP 0 0 0 CorBFlow Ms Bflow(A) 0 0 BloodVol HeartVol • 0 = no change
CV Adaptations • O2 consumption • improvements depend on • prior fitness, type of training, age • can inc VO2 max ~20% • Performance can improve > than 20% • Heart Rate • training-dec resting and submax HR • inc Psymp tone to SA node • Max HR-dec ~3 bpm with training • progressive overload for continued adaptation • Stroke volume - 20% inc - rest, sub and max with training • slower heart rate - inc filling time • inc volume - inc contractility - SV
CV Adaptations • Stroke volume - cont. • EDV inc with training - due to inc left vent vol and compliance, inc blood vol, • Myocardial contractility increased • Better release and reuptake of calcium at Sarcoplasmic Reticulum • Shift in isoform of myosin ATPase • increased ejection fraction • (a-v)O2 difference • inc slightly with training due to ; • right shift of Hb saturation curve • mitochondrial adaptation • Hb and Mb [ ] • muscle capillary density
CV Adaptations • Blood pressure - decreased resting and submax BP • Blood flow • training - dec coronary blood flow rest and submax (slight) • inc SV and dec HR - dec O2 demand • inc coronary flow at max • no inc in myocardial vascularity • inc in muscle vascularity - • dec peripheral resistance - inc Q • dec muscle blood flow at sub max • inc extraction - more blood for skin... • 10 % inc in muscle flow at max • no change in skin blood flow - though adaptation to exercise in heat does occur