Download
1 / 14
150 likes | 271 Views
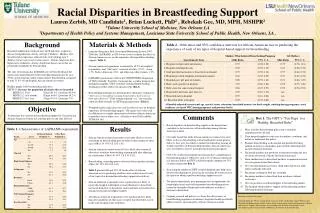
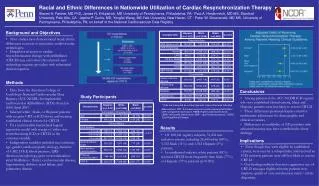
New Mexico’s Racial and Ethnic Disparities Report Card. Vicky Howell, Ph.D., Office of Policy and Performance New Mexico Department of Health. Overview of the Report Card.

E N D
New Mexico’s Racial and Ethnic Disparities Report Card Vicky Howell, Ph.D., Office of Policy and Performance New Mexico Department of Health
Overview of the Report Card • Funded through a State Partnership Grant to Improve Minority Health from the U.S. Department of Health and Human Services, Office of Minority Health • Modeled after North Carolina’s report card • Developed in a user-friendly format for the public • Updated annually • Generated the American Indian Health Disparities Report Card • Imitation is the best form of flattery – Delaware used New Mexico’s 2006 format
Purpose of the Report Card In New Mexico • Serves as the focal point for planning and activities geared towards reducing health disparities • Creates a cohesive approach to identifying health disparities • Increases awareness of health disparities • Elicits private, public and community input on possible solutions • Drives the activities of the Office of Health Equity
Format – Changes over Time • Added trend graphs (2007) • Added national comparisons and gender data (2007) • Added section on changes in disparity (2008) • Added Pertussis indicator (2008) • Added table of contents (2009) • Added summary data (2010) • Adding fall-related deaths (2011)
Topics Covered • Mother and Child Health(prenatal care, infant mortality, teen births) • Chronic Disease (adults with diabetes not receiving services, diabetes deaths, adult obesity, youth obesity) • Infectious Diseases (adults 65+ no pneumonia vaccination, pneumonia & influenza deaths, Chlamydia, hepatitis B, HIV/AIDS, Pertussis) • Violence and Injury (motor vehicle deaths, suicide, youth suicide, homicide) • Risk Behaviors(smoking, drug induced deaths, alcohol-related deaths)
Methodology • Indicators reflect areas in which New Mexico’s rates are higher than the national rate (e.g. suicide), or • Demonstrate large disparities between populations (e.g. hepatitis B, infant mortality), or • Demonstrate both high New Mexico rates and large disparities between populations (e.g. teen births, drug-induced deaths)
Methodology • Rates are calculated using standard practice for vital statistics and survey data • Handled small populations by using a 3-year rolling average • Disparity ratio calculated based on comparison of rates but only for populations with at least 20 cases during time period • Reference (comparison) group is determined by using the population with best (lowest) rate and at least 20 cases during time period
Sources of Data • Vital Statistics (Birth and Death Certificates) • Behavioral Risk Factor Surveillance System • Youth Risk and Resiliency Survey • Infectious Disease Surveillance
Uses of Report Card • Program Planning • Grant Writing • Academic Classes • Conferences • Legislative Hearings • Public Events • Community Awareness/Planning/Activities
Challenges • Challenges -Grades (love them or hate them) • Perception of Rating Populations Not Disparities • Program Perception of Rating Program Performance • Small Populations • Total New Mexico population just over 2 million • Black/African-American population of <50,000 • Asian population of <30,000
Lessons Learned • Realized that the report card needed to be community-friendly vs. a technical epidemiological report in order for it to be used effectively • Consolidation of data on health disparities all in one document increases awareness • Serves as a key reference for planning, targeted activities and evaluation • Color and pictures help • Can’t please everyone (e.g. grades)
Key Collaborations • Within the Division • Policy, data, and desktop publishing perspectives • External to Division • Advisory group • Data sources
Link to New Mexico’s Racial and Ethnic Health Disparities Report Cardhttp://nmhealth.org/dpp/health_disparities.shtml