Gantt Chart in Salesforce
0 likes | 22 Views
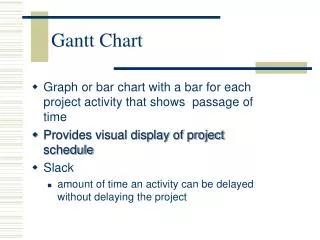
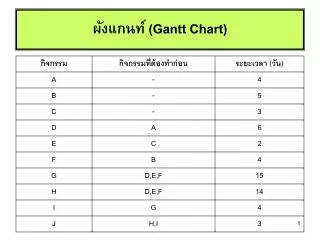
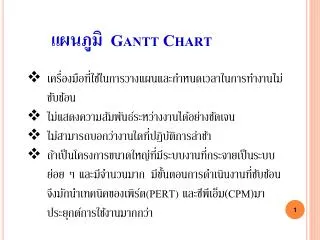
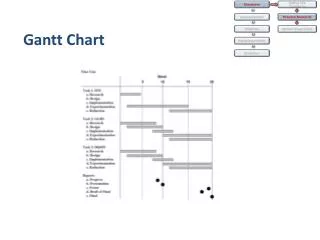
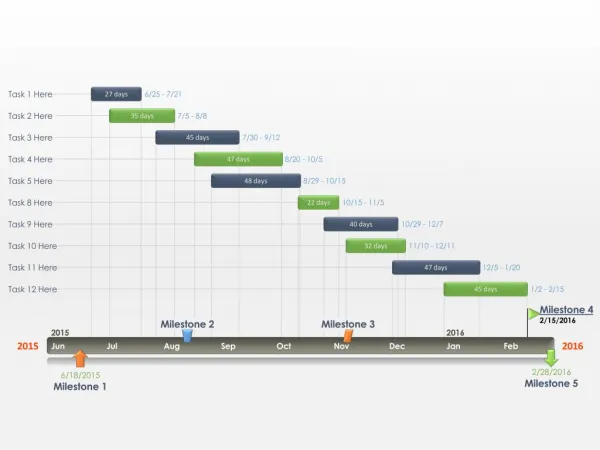
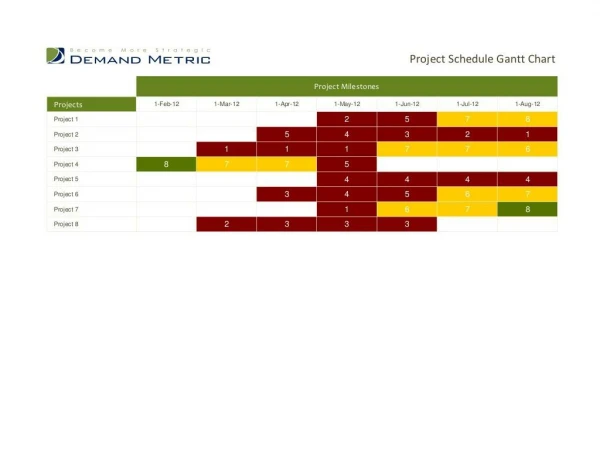
A Gantt chart is a visual representation of a project schedule that shows the start and finish dates of various elements of the project. Read here to learn more about the Gantt chart in Salesforce.
Download Presentation 
Gantt Chart in Salesforce
An Image/Link below is provided (as is) to download presentation
Download Policy: Content on the Website is provided to you AS IS for your information and personal use and may not be sold / licensed / shared on other websites without getting consent from its author.
Content is provided to you AS IS for your information and personal use only.
Download presentation by click this link.
While downloading, if for some reason you are not able to download a presentation, the publisher may have deleted the file from their server.
During download, if you can't get a presentation, the file might be deleted by the publisher.
E N D
Presentation Transcript


More Related