Download
1 / 13
130 likes | 260 Views
Improving the View of Air Quality from Space Jim Crawford Science Directorate NASA Langley. National Ambient Air Quality Standards (NAAQS): Violations are primarily related to ozone and fine particulate matter. 24-hour PM2.5 concentrations in µg/m3, 2007

E N D
Improving the View of Air Quality from Space Jim Crawford Science Directorate NASA Langley
National Ambient Air Quality Standards (NAAQS): Violations are primarily related to ozone and fine particulate matter. 24-hour PM2.5 concentrations in µg/m3, 2007 (98th percentile 24-hour concentration) Ozone concentrations in ppm, 2007 (fourth highest daily max 8-hour concentration). * Yellow and Red symbols represent levels in violation of NAAQS Taken from National Air Quality-Status and Trends through 2007 (http://www.epa.gov/airtrends/2008/)
Transport/Transformation Emission Removal (NOx, CO, Hydrocarbons, particulates) (O3, OH, CH2O, HO2, RO2, particulates) (HNO3, H2O2, ROOH, particulates)
Transport/Transformation Emission Removal (NOx, CO, Hydrocarbons, particulates) (O3, OH, CH2O, HO2, RO2, particulates) (HNO3, H2O2, ROOH, particulates)
OMI & MLS: Global Tropospheric Ozone Residual OMI & MLS produce a tropospheric ozone product by subtracting the MLS stratospheric ozone from OMI column ozone. Notice that largest ozone enhancements are downwind of source regions
OMI Tropospheric Nitrogen Dioxide (NO2 ) North America Europe Asia
MODIS Aerosol Optical Depth (AOD) IDEA: Infusing satellite Data into Environmental Applications (http://www.star.nesdis.noaa.gov/smcd/spb/aq/)
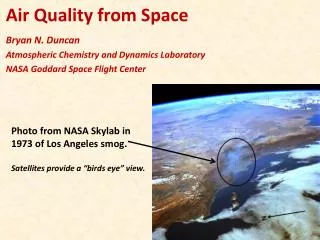
Investigation Rationale Near-surface pollution is one of the most challenging problems for Earth observations from space… Near-surface information must be inferred from column-integrated quantities obtained by passive remote sensing from downward-looking satellite instruments. Some constituents have large relative concentrations in the stratosphere and/or free troposphere (e.g., O3 and NO2) making it difficult to distinguish the near-surface contribution to the total column. Stratospheric Burden Long-range transport of pollution aloft Boundary layer depth influences the volume over which surface pollution is mixed It also matters how well the pollution is mixed From space, the size of the measurement pixel matters (as does grid size for models) Additional important factors include relative humidity and surface albedo
Investigation Overview Deriving Information on Surface Conditions from Column and VERtically Resolved Observations Relevant to Air Quality A NASA Earth Venture campaign intended to improve the interpretation of current and future satellite observations to diagnose near-surface conditions relating to air quality Objectives: 1. Relate column observations to surface conditions for aerosols and key trace gases O3, NO2, and CH2O 2. Characterize differences in diurnal variation of surface and column observations for key trace gases and aerosols 3. Examine horizontal scales of variability affecting satellites and model calculations NASA UC-12 NASA P-3B Deployments and key collaborators Maryland, July 2011 (EPA, MDE, UMd, UMBC, Howard U.) California, January 2013 (EPA, CARB, UC-Davis&Irvine) Texas, September 2013 (EPA, TCEQ, U. of Houston) TBD, Summer 2014 NATIVE, EPA AQS, and associated Ground sites
Deployment Strategy Systematic and concurrent observation of column-integrated, surface, and vertically-resolved distributions of aerosols and trace gases relevant to air quality as they evolve throughout the day. Three major observational components: NASA UC-12 (Remote sensing) Continuous mapping of aerosols with HSRL and trace gas columns with ACAM NASA P-3B (in situ meas.) In situ profiling of aerosols and trace gases over surface measurement sites Ground sites In situ trace gases and aerosols Remote sensing of trace gas and aerosol columns Ozonesondes Aerosol lidar observations