Heatmap Data Visualization Methods
Heatmap data visualization is one of the best methods to enhance user experience and also the efficiency of your site or your application. Reach out to your website!

Heatmap Data Visualization Methods
E N D
Presentation Transcript
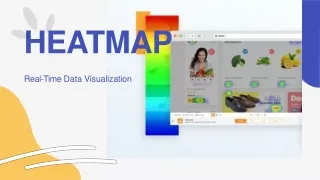
HEATMAP Real-Time DataVisualization
Accordingtoa study,65%of peoplelearn betterthrough visuals thantext. That is where heatmaps come inhandy!
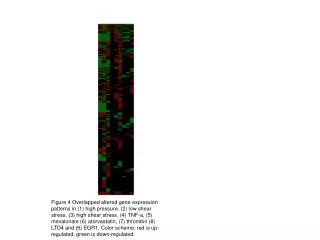
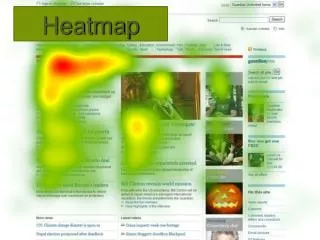
What is Heatmap ? Heatmap is a way to visually analyze the data that your website provides, in a color- coded scheme graphically to get insights into yourvisitor’s actions on yourwebsite.
Tool for website conversions. It helps you toknowhow your visitorsbehavewith your website andtoknow what worksforyour website & what doesnot.
Attainmaximum efficiency. Attaining the ideal length of thepage Ensuring Call To Action (CTA) Buttons working for youraudience Ensuring easier navigability throughout yourwebsite Identifying maximum hyperlinking opportunities
Heatmapshelp youvisualize data inreal- time. Real-Time Data Visualization through heatmaps basically refers to datathat is frequently updated without anylag.
Updated version of theinteraction. Heatmap tracks every movement that your user makes and shows you a real- time updated version of the interactionof your user with yourwebsite.
Different types of Heatmaps fordata visualization Different types of data visualization usingdifferent types ofHeatmaps.
Scrollheatmap data visualization. A scroll map helps youprovidedata to understand eachandevery section of your webpage thatis scrolled by theuser.
Click heatmaps datavisualization A click map helps you provide datato understand the clicks on yourwebpage.
Mouse tracking heatmaps data visualization A mouse tracking map helps youprovide data on the basis of your user’s mouse movement on yourwebsite. It gives you data such as the sections where the user’s mouse hovers themost and least on yourwebpage.
Eye-tracking heatmapsdata visualization Eye-tracking provides you heatmap data visualization on how the visitor’s eyetravels throughout yourwebpage.
While designing website, you need to set a goals as to whatis the purpose of website and based on that select theHeatmap.
Heatmaps act as a great guide foryou to understand what works on your website and what does not –what CTA’s work thebest. Enhance your user’s experience.
For more, get in touch withus: +91-9015-316-316 www.notifyvisitors.com support@tagnpin.com