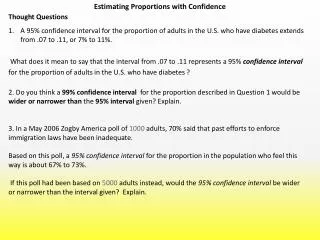
ESTIMATING with confidence
ESTIMATING with confidence. A confidence interval gives an estimated range of values which is likely to include an unknown population parameter, the estimated range being calculated from a given set of sample data. Confidence INterval. CI: the Basic.

ESTIMATING with confidence
E N D
Presentation Transcript
A confidence interval gives an estimated range of values which is likely to include an unknown population parameter, the estimated range being calculated from a given set of sample data. Confidence INterval
CI: the Basic The admission directors at the Big City University has a novel idea. He proposes using the IQ scores of current students as a marketing tool. So the director gives the IQ test to an SRS of 50 of the university's 5000 freshmen. The mean IQ score of the sample is 112. What can the director say about the mean score of the population of all 5000 freshmen?
σx-bar = 15 / √50 =2.1 =112 n=50 N=5 000 Supposed we know the standard deviation σ=15
From and SRS of 50 Margin of error: m=2σ=4.2 σx-bar=2.1 =112
Conclusion: IQ @ BCU _ Our sample of 50 freshmen gave x = 112. The resulting interval is 112 ± 4.2, (107.8, 116.2). We say that we are 95% confident that the unknown mean IQ score for all BCU freshmen is between 107.8 and 116.2 - 1. The interval between 107.8 and 116.2 contains the true µ. 2. Our SRS was one of the few samples for which x is not within 4.2 points of the true µ. Only 5% of all samples give such inaccurate result
EXAMPLE Bianca wanted to know the average weight of all the female students in UCLA. She went to UCLA and surveyed 50 female students in random and found out that their mean weight is 135lbs. She estimated that the population standard deviation is about 3.5lbs. With all the information that she gathered, How can she estimate the true average weight of all the female students within 2standard deviations, based on her sample?
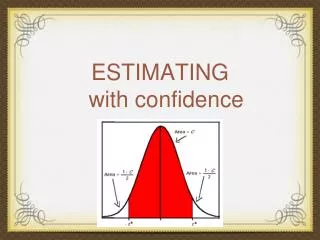
Confidence INterval and Confidence Level • A level C confidence interval for a parameter has 2 points: • A confidence interval calculated from the data, usually form • Estimate ± margin of error • A confidence interval C which gives the probability that the interval will capture the true parameter value in repeated samples. That is, the confidence level is the success rate for the method
1. The data come from SRS from the population of interest. 2. The sampling distribution of x is approximately Normal. 3. Individual observations are independent; when sampling without replacement, the population size N is at least 10 times the sample size of n. _ Conditions for Constructing the Confidence Interval for ℳ
AP Test TIP Common error for students taking AP Test: Failure to identify the conditions by which they are justified in constructing a confidence interval.
σ _ X ± z* √n Confidence INterval for a populations MEAN ( is known) σ
Inference toolbox Step 1: Identify the population of interest and the parameter you want to draw conclusion about. Step 2: Choose the appropriate inference procedure. Verify the conditions for using the selected procedure. CI: estimate ± margin of error Step 4: Interpret your result in the context of the problem
IQ TEST SCORES Here are the IQ test scores of 31 7th grade girls in a midwestern school district: Supposed that the standard deviation of IQ scores in this population is know to be σ=15. Construct and interpret a 99% confidence interval for the mean IQ score in the population.
The 99% CI for ℳ is: With 99% confidence, we estimate the mean IQ score for all 7th grade girls in the school district to be between 98.90 and 112.78 IQ points 105.84 ± 2.576 (15/√31) = SRS: The data came from 7th grade girls in a midwestern school district Normality: Since the sample came from 31 7th grade students, we can say that from the Central Limit Theorem that the sampling distribution of x-bar will be approximately Normal. Independence: from the 1st rule of thumb in sample proportion, where N≧10, a sample size of 310 is more likely less than the population of all 7th grade female midwestern students. (98.90, 112.78) 105.84 ±6.94 =
Interpreting Confidence Interval When collecting ______ samples repeatedly, we are ________ confident that the true µ will be contained in that interval.