Estimating Proportions with Confidence
180 likes | 341 Views
Estimating Proportions with Confidence. Thought Questions. A 95% confidence interval for the proportion of adults in the U.S. who have diabetes extends from .07 to .11, or 7% to 11%. What does it mean to say that the interval from .07 to .11 represents a 95% confidence interval

Estimating Proportions with Confidence
E N D
Presentation Transcript
Estimating Proportions with Confidence Thought Questions • A 95% confidence interval for the proportion of adults in the U.S. who have diabetes extends from .07 to .11, or 7% to 11%. • What does it mean to say that the interval from .07 to .11 represents a 95% confidence interval • for the proportion of adults in the U.S. who have diabetes ? • 2. Do you think a 99% confidence interval for the proportion described in Question 1 would be wider or narrower than the 95% interval given? Explain. • 3. In a May 2006 Zogby America poll of 1000 adults, 70% said that past efforts to enforce immigration laws have been inadequate. • Based on this poll, a 95% confidence interval for the proportion in the population who feel this way is about 67% to 73%. • If this poll had been based on 5000 adults instead, would the 95% confidence interval be wider or narrower than the interval given? Explain.
Estimating Proportions with Confidence Confidence Intervals for Proportion sample proportion equals count of successes in the sample sample size Red dot represents the sample proportion for each sample Green horizontal line represents the true population proportion. Blue lines represent the width of the confidence interval • Statistical inference draws conclusion about a population on the basis of data about a sample. • Numbers that describe a population are parameters, example: true population proportion. • To estimate a population parameter, choose a sample from the population and use a statistic, the sample proportion
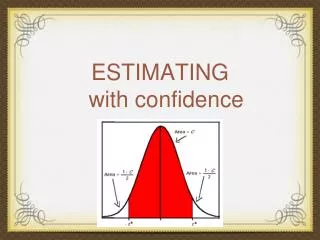
Estimating Proportions with Confidence Estimating True Population Proportions with Confidence Recall that the sampling distribution model of the sample proportion is Normal and centered at the true population proportion, with standard deviation . (true proportion)(1 – true proportion) sample size Since we don’t know true population proportion, we can’t find the true standard deviation of the sampling distribution model, so we need to find the standard error (SE) of the sample proportion (sample proportion)(1 – sample proportion) sample size • By the 68-95-99.7% Rule, we know • about 68% of all samples will have sample proportion’s are within 1 SE of the true proportion • about 95% of all samples will have sample proportion’s within 2 SEs of the true proportion • about 99.7% of all samples will have sample proportion’s within 3 SEs of the true proportion • Statistically (for a 95% C.I.): in repeated samples, 95% of the calculated confidence intervals should contain the true proportion.
Estimating Proportions with Confidence Example: Say the truth is that 13% of college students in California engaged in binge drinking in 2006. Thus, a sample of size n = 2166 would, if repeated many times, produce sample proportions that closely follow the Normal distribution center around the true proportion equal to 0.13 with standard deviation : (0.13)(1 – 0.13) 2166 = 0.0072 true proportion – 2 standard deviations = 0.13 – 0.0144 = 0.1156 and true proportion + 2 standard deviations = 0.13 + 0.0144 = 0.1444
Estimating Proportions with Confidence Example Continued: In reality, we don’t know the true population proportion. It is what we are trying to estimate with our sample. So we use the standard error (SE) of the sample proportion. A 95% confidence interval for a population proportion: sample proportion ± 2(SE) where SE = (sample proportion)(1 – sample proportion) sample size If the random sample of 2166 college graduates in California found that 279 had engaged in binge drinking in 2006, the sample proportion is 0.129. The 95% confidence interval for the proportion college graduates in California who engaged in binge drinking in 2006 is 0.129 ± 2 (0.129)(1 – 0.129) 2166 = 0.129 ± (2) (0.0072) = 0.129 ± 0.0144 = 0.1146 to 0.1434 We are 95% confident that the true proportion (percentage) of all college graduates in California who engaged in binge drinking in 2006 lies between 11.46% and 14.34%.
Estimating Proportions with Confidence What Does “95% Confidence” Really Mean? • Each confidence interval uses a sample statistic to estimate a population parameter. • But, since samples vary, the statistics we use, and thus the confidence intervals we construct, vary as well. • Our confidence is in the process of constructing the interval, not in any one interval itself. • Thus, we expect 95% of all 95% confidence intervals to contain the true parameter that they are estimating.
Estimating Proportions with Confidence (0.37)(1 – 0.37)= 0.038 165 (0.46)(1 – 0.46)= 0.045 120 Example : Experiment in ESP • Experiment: Subject tried to guess which of four videos the “sender” was watching in another room. • Of the 165 cases, 61 resulted in successful guesses. • sample proportion= 61/165 = 0.37 or 37% • standard error of sample proportion = • confidence interval = .37 ± 2(0.038) = .37 ± .08 or 0.29 to 0.45 • Example : Quit Smoking with the Patch • Study: Of 120 volunteers randomly assigned to use a nicotine patch, 55 had quit smoking after 8 weeks. • sample proportion= 55/120 = 0.46 or 46% • standard error of sample proportion = • confidence interval = .46 ± 2(0.045) = .46 ± .09 or 0.37 to 0.55
Estimating Proportions with Confidence Margin of Error: Certainty vs. Precision • We can claim, with 95% confidence, that the interval : • sample proportion ± 2(SE(of the sample proportion)) • contains the true population proportion. • The extent of the interval on either side of the sample proportion is called the margin of error (ME). • In general, confidence intervals have the form estimate± ME. • The more confident we want to be, the larger our ME needs to be.
Estimating Proportions with Confidence Common Values of Standardized Score
Estimating Proportions with Confidence Certainty vs. Precision • To be more confident, we wind up being less precise. Because of this, every confidence interval is a balance between certainty and precision. • The tension between certainty and precision is always there. • The choice of confidence level is somewhat arbitrary, but keep in mind this tension between certainty and precision when selecting your confidence level. • The most commonly chosen confidence levels are 90%, 95%, and 99%.
Estimating Proportions with Confidence What Can Go Wrong? Don’t Misstate What the Interval Means • Don’t suggest that the parameter varies. • Don’t claim that other samples will agree with yours. • Don’t be certain about the parameter. • Margin of Error Too Large to Be Useful • We can’t be exact, but how precise do we need to be? • One way to make the margin of error smaller is to reduce your level of confidence. • You need to think about your margin of error when you design your study. • To get a narrower interval without giving up confidence, you need to have less variability. You can do this with a larger sample…
Estimating Proportions with Confidence Examples of Confidence Intervals from the Media Midterm Election 2010 Lynch: CI: (45.7, 52.3) Seetak: CI: (37.7, 44.3) Results: Lynch 53% Stephen: 45% Brown: CI: (43.9, 52.1) Whitman: CI: (32.9, 41.1) Results: Brown 54% Whitman: 41%
Estimating Proportions with Confidence Toomey: CI: (47.2, 52.8) Seetak: (42.2, 47.8) Results: Toomey :51% Seetak: 49% Boxer CI: (41.9, 50.1) Fiorina: (33.9, 42.1) Results: Boxer 52% Fiorina: 43% CNN: Poll CenterResults
Estimating Proportions with Confidence (0.27)(1 – 0.27)= 0.008 3118 (0.84)(1 – 0.84)= 0.007 3118 Alzheimers in the US – Based on Poll of 3118 adults nationwide Prevalence sample proportion = .27 standard error of sample proportion = confidence interval = .27 ± 2(0.008) = .27 ± .016 = 0.254 to 0.286 or 25.4% to 28.6% Q: Are you concerned? sample proportion = .84 standard error of sample proportion = confidence interval = .84 ± 2(0.007) = .84 ± .014 = 0.826 to 0.854 or 82.6% to 85.4%
Estimating Proportions with Confidence Text Questions • 4. A telephone poll reported in Time magazine (6 February 1995, p. 24) asked 359 adult Americans the question, "Do you think Congress should maintain or repeal last year's ban on several types of assault weapons?" Seventy-five percent responded "maintain.“ • Compute the standard error for the sample proportion of .75. • b. Time reported that the "sampling error is ± 4.5%." Verify that 4.5% is approximately • what would be added and subtracted to the sample proportion to create a 95% confidence interval. • c. Use the information reported by Time to create a 95% confidence interval for the population proportion. Interpret the interval in words that would be understood by someone with no training in statistics. Be sure to specify the population to which it applies.