Download

1 / 4
0 likes | 2 Views
Discover how a Power BI IT Operations Dashboard helps reduce downtime through real-time monitoring, proactive alerts, and data-driven insights. Improve IT performance today.

E N D
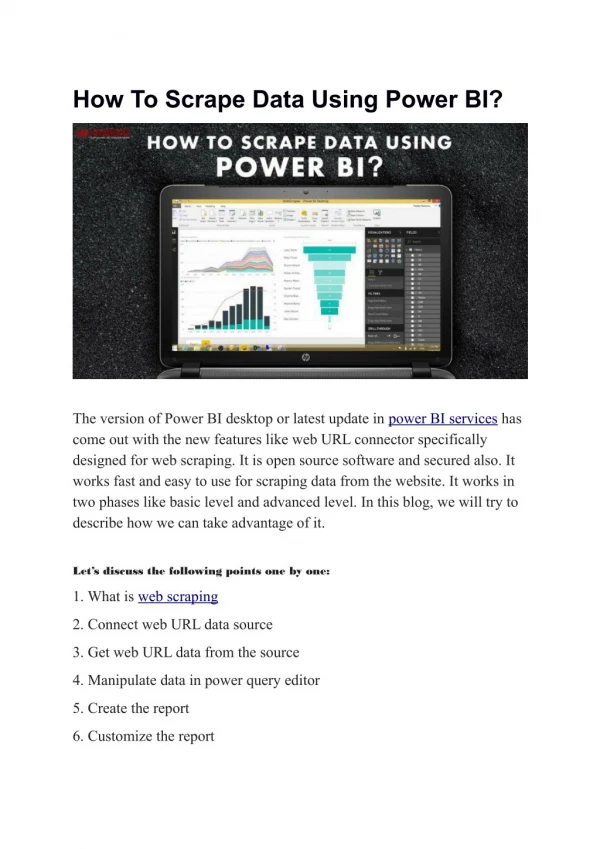
Top 10 KPIs to Track Using a Power BI IT Operations Dashboard Every single second matters when you work in IT. If you’re responsible for managing enterprise servers, clouds or application structure, you need real-time information about how they are performing at all times. IT teams have to be prepared, informed by data and proactive. Yet, how do you monitor all the events happening within your ecosystem? Key Performance Indicators (KPIs) should be measured and then displayed to find the answer. An IT Operations Dashboard using Power BI helps you see data as clear visuals so that your team can detect problems, boost performance and choose wisely. We’ll discuss why KPIs are important and identify the top 10 metrics every IT ops team should keep track of. Why KPIs Matter in IT Operations? KPIs exist to show what is going well in a business and what isn’t. They reveal the states of your systems, how your teams respond and how pleased your users are. If you don’t use KPIs, you’re left without any guidance. Using an IT Operations Dashboard in Power BI, IT staff can bring all their important information together and watch key metrics change in real time. Power BI’s user- friendly layout helps anyone discover data fast, interact with reports and make changes which is why it suits both tech-savvy staff and higher-level managers.
If your goal is to improve uptime, keep service agreements or improve how the helpdesk works, useful KPIs can make a big difference for your business. Top 10 KPIs to Track Using a Power BI IT Operations Dashboard 1. System Uptime System uptime is the share of time your systems and infrastructure are functional and can be used. If you want users to be happy and the business to run smoothly, keep your server online as much as possible. On the Power BI dashboard, you can tell when the network is down, track how much it’s used and observe areas where the network is not performing well. Gauges and colored trend lines help you quickly show progress to other colleagues. 2. Mean Time to Repair MTTR helps you see how quickly incidents are resolved from the moment they are identified. A slow MTTR usually shows that your team is not handling support or troubleshooting efficiently. You can see how MTTR varies by breaking it down by department, system or support staff member. You can spot instances where things slow down and introduce improvements to cut your response time which improves the experience for users. 3. The amount of reports on health incidents This KPI allows you to see how many incidents or support tickets have been raised during a given time frame. When many incidents occur at the same time, it may mean the network, hardware or an application has problems. You are able to group incidents in Power BI by their priority, the source they came from or which category of asset they correspond to. Heatmaps and bar graphs support your IT managers in locating defects more quickly. 4. Percentage of Server/CPU Use A system performs well when resources are distributed efficiently. By watching CPU, RAM and disk levels, you prevent your computer hardware from being pushed too hard. Power BI shares immediate and historical updates about server utilization which helps IT managers predict future demand and prepare for upgrades. It tells you when your vehicle is close to unsafe levels which helps stop problems before they get serious.
5. Network Latency and Throughput If a network is slow, it can seriously slow down how much work can get done. Keep an eye on both latency and throughput in order to improve how your application works. Power BI makes it easy to see traffic changes, discover the main reasons for delays and tie latency to key performance measures. It enables network engineers to act in advance and direct bandwidth to where it’s required. 6. What percent of SLA responsibilities have been fulfilled? SLAs set standards of service for partnerships with either internal staff or outside clients. If your ticketing responds late, your system is unmaintained or data cannot be recovered quickly—failure to meet SLAs can be pricey. A Power BI IT Operations Dashboard makes it easy for you to see where your company is meeting compliance requirements. Emphasizing at-risk service-level agreements and delayed jobs allows teams to solve problems ahead of time. 7. Events and breaches that involve security Cybersecurity always comes first in the minds of IT teams. It is very important to follow unauthorized logins, malware infections and suspicious things happening. When Power BI is joined with your SIEM system, you can watch for breaches, detect weak assets and promptly take action. Looking at these charts, security teams understand where to direct their efforts first. 8. How often does the change succeed? Updates during change management do not always proceed smoothly. How many changes (patches, deployments, upgrades) did not result in issues is what this KPI measures. With Power BI, you can view how things have changed in the past, find out what didn’t work with your deployments and make improvements to your change management process. Many useful metrics including pie charts, trend lines and feedback data can fit onto a single organized dashboard view. 9. Support Ticket Volume Tracking tickets will show you the general workload facing your helpdesk. Through Power BI, you can observe who is creating, closing, escalating or leaving open these interactions. You can also keep track of response time, how long it takes to solve issues and how pleased customers are. Thus, you can manage both your staff and their responsibilities to restore quality service. 10. Sorted Data by What Lasted We need to understand why an application fails when it happens. Using Power BI, it is possible to group downtime by the reason for it, whether it is a database error, a
trouble with third-party APIs or an outage with your server. Identifying how items fit together and correlate with each other allows you to do root cause analysis and organize your development activities. Because of custom filters and real-time warnings, it becomes easier to avoid identical incidents. To conclude: Visibility and Action are Important Watching KPIs ensures that IT services always provide safety, consistency and great performance. Through a Power BI IT Operations Dashboard, your staff finds the knowledge to improve their work, move quickly and achieve good results. When you use these 10 KPIs, you set a strong base for high performance and sustainable business growth. Regardless of if you require less unplanned down time, stronger SLA compliance or simple infrastructure forecasting—Power BI allows you to see the results instantly and accurately. Want to start using a customized Power BI dashboard for IT operations in your business? Now you need to make decisions based on your data.