1 / 20
200 likes | 542 Views
This Edureka Power BI Dashboard Tutorial will take you through step by step creation of Power BI dashboard. It helps you learn different functionalities present in Power BI tool with a demo on superstore dataset. You will learn how to create a Power BI dashboard by taking out multiple insights from superstore dataset and representing them visually.

E N D
Copyright © 2017, edureka and/or its affiliates. All rights reserved.
Agenda 1 What are the interfaces in Power BI 2 What are the functionalities of Power BI 3 How to create a Dashboard in Power BI 4 How to use Power BI in a real-time scenario Copyright © 2017, edureka and/or its affiliates. All rights reserved.
What Is Power BI? Now, let’s understand what is Power BI Copyright © 2017, edureka and/or its affiliates. All rights reserved.
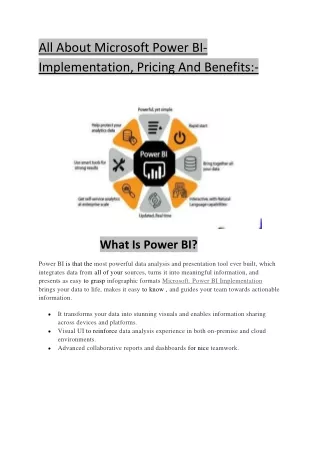
What Is Power BI? ▪ Power BI is a cloud-based business intelligence tool that provides interactive visualizations with SSBI capabilities Copyright © 2017, edureka and/or its affiliates. All rights reserved.
What Is a Dashboard? Let’s understand what is a Dashboard in Power BI Copyright © 2017, edureka and/or its affiliates. All rights reserved.
What is a Dashboard? ▪ A Power BI dashboard is a single page, often called a canvas, that uses visualizations to tell a story. Because it is limited to one page, a well-designed dashboard contains only the most-important elements of that story. Copyright © 2017, edureka and/or its affiliates. All rights reserved.
Dashboard VS Report Capability Dashboards Reports Pages One page One or more pages One or more reports and one or more datasets per dashboard Data sources A single dataset per report Can pin visualizations (as tiles) to any of your dashboards. Can pin entire report pages to any of your dashboards. Can pin existing visualizations (tiles) only from current dashboard to your other dashboards Pinning Filtering Can't filter or slice Many different ways to filter, highlight, and slice Can create alerts to email you when certain conditions are met Can set one dashboard as your "featured" dashboard Available from dashboard Set alerts No Feature Cannot create a featured report Natural language queries Not available from reports No, if a report owner changes the visualization type in the report, the dashboard does not update Can change visualization type Yes Can do things with the visualizations (tiles) like move and arrange, resize, add links, rename, delete, and display full screen. But the data and visualizations themselves are read-only. In Reading view you can publish, embed, filter, and more. In Editing view you can do everything mentioned so far and so much more. Customization Copyright © 2017, edureka and/or its affiliates. All rights reserved.
Dataset - Superstore ▪ Data of Superstore in US of an organization. ▪ Data was collected between 2011 - 2014 Copyright © 2017, edureka and/or its affiliates. All rights reserved.
Insights Let us now look at the insights needed. Copyright © 2017, edureka and/or its affiliates. All rights reserved.
Insight 1 – Overall Performance ▪ Overall trend of Sales and profits of Superstore. ▪ Performance of different regions. ▪ Profitable and Non- Profitable Regions. Copyright © 2017, edureka and/or its affiliates. All rights reserved.
Insight 2 – Performance of Different States ▪ Performance of each state. ▪ States showing opportunity to grow. Copyright © 2017, edureka and/or its affiliates. All rights reserved.
Insight 3 – Segment Performance ▪ Performance of segments of the Superstore in different states and region. Copyright © 2017, edureka and/or its affiliates. All rights reserved.
Insight 4 – Revenue Generation ▪ Revenue generated by each category of product. ▪ Category/Product hampering revenue growth Copyright © 2017, edureka and/or its affiliates. All rights reserved.
Power BI Installation Let’s understand now install Power BI. Copyright © 2017, edureka and/or its affiliates. All rights reserved.
Power BI Installation Copyright © 2017, edureka and/or its affiliates. All rights reserved.
Demo Lets look at the capability of Power BI Desktop Copyright © 2017, edureka and/or its affiliates. All rights reserved.
Power BI Trends Lets try to understand the current market trends for Power BI Copyright © 2017, edureka and/or its affiliates. All rights reserved.
Power BI Job Trends Copyright © 2017, edureka and/or its affiliates. All rights reserved.
Power BI Salary Trend Copyright © 2017, edureka and/or its affiliates. All rights reserved.