Download
1 / 70
700 likes | 867 Views
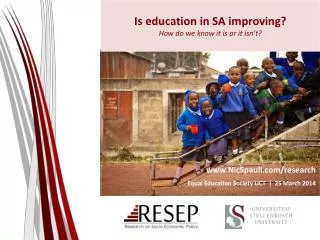
Is education in SA improving? How do we know it is or it isn’t?. www.NicSpaull.com/research Equal Education Society UCT | 25 March 2014. 1) South Africa performs extremely poorly on local and international assessments of educational achievement. State of SA education since transition.

E N D
Is education in SA improving?How do we know it is or it isn’t? www.NicSpaull.com/research Equal Education Society UCT | 25 March 2014
1) South Africa performs extremely poorly on local and international assessments of educational achievement
State of SA education since transition • “Although 99.7% of South African children are in school…the outcomes in education are abysmal” (Manuel, 2011) • “Without ambiguity or the possibility of misinterpretation, the pieces together reveal the predicament of South African primary education” (Fleisch, 2008: 2) • “Our researchers found that what students know and can do is dismal” (Taylor & Vinjevold, 1999) • “It is not an overstatement to say that South African education is in crisis.” (Van der Berg & Spaull, 2011)
Student performance 2003-2011 prePIRLS(2011) TIMSS (2011) ANA (2011) TIMSS (2003) PIRLS (2006) SACMEQ (2007) TIMSS 2003 (Gr8 Maths & Science) • Out of 50 participating countries (including 6 African countries) SA came last • Only 10% reached low international benchmark • No improvement from TIMSS 1999-TIMSS 2003 PIRLS 2006(Gr 4/5 – Reading) • Out of 45 participating countries SA came last • 87% of gr4 and 78% of Gr 5 learners deemed to be “at serious risk of not learning to read” SACMEQ III 2007(Gr6 – Reading & Maths) • SA came 10/15 for reading and 8/15 for maths behind countries such as Swaziland, Kenya and Tanzania ANA 2011 (Gr 1-6 Reading & Maths) • Mean literacy score gr3: 35% • Mean numeracy score gr3: 28% • Mean literacy score gr6: 28% • Mean numeracy score gr6: 30% TIMSS 2011(Gr9 – Maths & Science) • SA has joint lowest performance of 42 countries • Improvement by 1.5 grade levels (2003-2011) • 76% of grade nine students in 2011 still had not acquired a basic understanding about whole numbers, decimals, operations or basic graphs, and this is at the improved level of performance prePIRLS2011 (Gr 4 Reading) • 29% of SA Gr4 learners completely illiterate (cannot decode text in any langauge) • NSES 2007/8/9 • Systemic Evaluations 2007 • Matric exams
Qualifications by age (birth cohort), 2011 (Van der Berg, 2013)
Basic overview of matric 2013 The good… • Matric pass rate increased to 78% • Bachelor pass rate increased to 31% • More students passing mathematics The bad… • Some questioning quality of matric pass • Public starting to ask questions about why uni’s are using NBTs • Concerns over “culling” and whether this lead to increases in NWP and FST The ugly… • Grade 812 dropout is 2x as high (50%) in Q1 rel to Q5 (25%) • Because of differences in average quality of education, a white child is 7 times more likely than a black child to obtain a Maths D+ and 38 times as likely to get an A- aggregate (using earlier matric data)
Focus on mathematics– things are improving • Number of students taking mathematics (as opposed to maths-lit) has declined since 2008, but proportion passing has risen • Not necessarily a bad thing since many of those students shouldn’t have been taking mathematics in the first place Source: Taylor(2014)
What proportion of matrics take and pass mathematics? • Important statistic is the number passing which was declining from 2008 2011 but has increased between 2011 2013 Source: Taylor(2014)
Matric mathematics statistics (Taylor 2014) Source: Taylor(2014) NOTE: All of the above is under the proviso that that quality of the mathematics exam has remained constant over the period. If not then we can’t say much.
Dropoutbetween Gr8 and Gr12 • Of 100 Gr8 quintile 1 students in 2009, 36 passed matric and 10 qualified for university • Of 100 Gr8 quintile 5 students in 2009, 68 passed matric and 39 qualified for university • “Contrary to what some would like the nation and the public to believe that our results hide inequalities, the facts and evidence show that the two top provinces (Free State and North West) are rural and poor.” (Motshekga, 2014)
550,000 students drop out before matric • 99% do not get a non-matric qualification (Gustafsson, 2011: p11) • What happens to them? 50% youth unemployment.
Proportion of a cohort of students that do not survive to grade 12, fail matric, pass matric, and pass matric with a Bachelor's pass in each province in 2011
Labour Market • University/FET • Type of institution (FET or University) • Quality of institution • Type of qualification(diploma, degree etc.) • Field of study (Engineering, Arts etc.) • High productivity jobs and incomes (17%) • Mainly professional, managerial & skilled jobs • Requires graduates, good quality matric or good vocational skills • Historically mainly white High quality secondaryschool Unequal society High SES background +ECD High quality primary school Minority (20%) Some motivated, lucky or talented students make the transition • Vocational training • Affirmative action • Big demand for good schools despite fees • Some scholarships/bursaries Majority (80%) Quality Type Attainment Low quality secondary school • Low productivity jobs & incomes • Often manual or low skill jobs • Limited or low quality education • Minimum wage can exceed productivity Low SES background Low quality primary school cf. Servaas van der Berg – QLFS 2011
Are things improving? • What should we be using to measure changes over time? • DEFINITELY *NOT* ANAs • Not psychometrically calibrated to be comparable year-on-year • No anchor items • No Item Response Theory • Not externally evaluated and independently marked • No, no, no. • Need a broader discussion of the potential perils of ANAs. Under-appreciated at the moment. ANA Fridays?! • Matric – sort of yes • Considerable institutional memory (decades of expertise and precedent) • Excludes half the cohort so not a good reflection of total education system • Can be tricky to tease out *real* trends. Things like subject combinations, culling, pass thresholds and clumping around the threshold etc. • Cross-national assessments – yes. • Best way of determining if there are changes over long periods of tims • TIMSS, PIRLS/prePIRLS/SACMEQ/ (perhaps PISA in SA soon) • Education and schooling (the main vehicle we use to “do/get it”) cannot be reduced to test scores or particular subjects (numeracy and literacy). However, that does *NOT* mean that there is no place for testing. Many educational outcomes are measurable and providing feedback to everyone (DBE, principals, parents, students) is an important form of accountability.
TIMSS 1995 2011 Figure 1: South African mathematics and science performance in the Trends in International Mathematics and Science Study (TIMSS 1995-2011) with 95% confidence intervals around the mean
Conclusion? • “The only cross-national survey of educational achievement that has shown any improvement has been TIMSS 2011 where there was a one and a half grade-level improvement in mathematics and science over the 2002-2011 period at the grade nine level. While this shows that there have been some recent improvements, it is difficult to celebrate when one considers how low the post-improvement level of performance really is. Three quarters (76%) of grade nine students in 2011 still had not acquired a basic understanding about whole numbers, decimals, operations or basic graphs, and this is at the improved level of performance. Part of the reason for the improvement is the fact that we started from an exceedingly low base in 2002. To place this in perspective, South Africa’s post-improvement level of performance is still the lowest of all participating countries, with the average South African grade nine child performing between two and three grade levels lower than the average grade eight child from middle-income countries” • (Spaull 2013 CDE report) • Yes, things are starting to improve in SA education. Starting from a VERY low base there are relatively clear indications that things are improving. Difficult to celebrate when one considers how low post-improvement level of performance.
Way forward? • Acknowledge the extent of the problem • Low quality education is one of the three largest crises facing our country (along with HIV/AIDS and unemployment). Need the political will and public support for widespread reform. • Focus on the basics • Every child MUST master the basics of foundational numeracy and literacy these are the building blocks of further education – weak foundations = recipe for disaster • Teachers need to be in school teaching (re-introduce inspectorate?) • Every teacher needs a minimum competency (basic) in the subjects they teach • Every child (teacher) needs access to adequate learning (teaching) materials • Use every school day and every school period – maximise instructional time • Have to make sure we don’t make the same mistakes with Grade R as we have with the rest of schooling • Increase information, accountability & transparency • At ALL levels – DBE, district, school, classroom, learner • Strengthen ANA. Get psychometrics right (so comparable across years), externally evaluate @ 1 grade • Set realistic goals for improvement and hold people accountable • Focus on teachers • Have to find a way of raising the quality of both (1) new, but especially (2) existing teachers • Q&A - Prof Muller (UCT): What do you think is the most under-researched area in South African education? • “We have no idea what it will take to make knowledgeable teachers out of clueless ones, at least not while they are actually on-the-job.”
Further issues we can discuss • Solution: Accountability & capacity • Solution: Identifying binding constraints • Mathematics teacher CK in SA • Grade R in SA • New and existing RESEP projects • What proportion of SA kids make it to uni? • Things to think about when introducing automated/tech solutions in SA (or anywhere) • Especially with reference to Dell Dashboards
Thank youComments & Questions?This presentation and papers available online at:www.nicspaull.com/research
Important distinctions Often these 3 are spoken about interchangeably
“Only when schools have both the incentive to respond to an accountability system as well as the capacity to do so will there be an improvement in student outcomes.” (p22)
Are matriculants prepared for higher education? • "It is widely accepted that student underpreparedness is the dominant learning-related cause of the poor performance patterns in higher education. It follows that it is the school sector that is most commonly held responsible. However, if higher education is to rely on improvement in schooling to deal with the systemic faults affecting it, there needs to be a rigorous assessment of the prospects of sufficient improvement being achieved within that sector. While the Task Team believes that the level of dysfunction in schooling must continue to be a primary focus of corrective effort, it has concluded that the overwhelming weight of evidence from current analyses of the school sector is that there is effectively no prospect that it will be able, in the foreseeable future, to produce the numbers of well-prepared matriculants that higher education requires.“ • CHE (2013) ”Proposal for undergraduate curriculum reform” http://www.che.ac.za/announcements/task-team-report-extended-curriculum-released • Why are universities using the National Benchmarking Tests (NBTs) now when they didn’t use them 10 years ago? Why for admission? • Presumably these tests are better able to distinguish between students that will and won’t be able to succeed at university
Higher education in perspective When speaking about higher education it’s important to remember that this is only a very small proportion of the population Source: DBE (2013) Internal Efficiency of the schooling System
Gustafsson, 2011 – When & how WP • “What do the magnitudes from Figure 4 mean in terms of the holding of qualifications? In particular, what widely recognised qualifications do the 60% of youths who do not obtain a Matric hold? …Only around 1% of youths hold no Matric but do hold some other non-school certificate or diploma issued by, for instance, an FET college” (Gustafsson, 2011: p.11) 10%
How does SA fair internationally? • Gustafsson (2011) “The when and how of leaving school”
Dropout and weak performance in matric is essentially a function of low-quality of education in earlier grades and accumulated learning deficits
NSES question 42NSESfollowed about 15000 students (266 schools) and tested them in Grade 3 (2007), Grade 4 (2008) and Grade 5 (2009). Grade 3 maths curriculum: “Can perform calculations using appropriate symbols to solve problems involving: division of at least 2-digit by 1-digit numbers” At the end of Grade 5 most (55%+) quintile 1-4 students cannot answer this simple Grade-3-level problem.
Take home points… • What does it mean to the economy? • Low quality of education continues to condemn majority of black children to an underclass where poverty & unempl. are the norm • What should we continue doing and what should we change? • Continue with ANAs and workbooks (keep CAPS, obviously) • Draw public attention to primary schooling (root of the problem) • More public acknowledgement of dropout. Measure throughput not just pass rates • Aim should NOT be for 100% of students to reach and pass matric. Need for an effective vocational system (something we don’t have) • What does the certificate mean to matriculants/higher-ed? • Matric is a necessary but not sufficient condition for employment (increasingly insufficient). What is the purpose of matric? • Are we moving in the right direction? • Yes-ish. Need a better commitment to SUBSTANCE not just FORM • Too much focus on “illustrating improvement” as opposed to actually getting down to it. ANAs a good example – really useful & imp but absolutely (unequivocally) cannot be used to show changes over time yet this is what the DBE is doing
Further reading • DBE (2013) The internal efficiency of the school system: Report on selected aspects of access to education, grade repetition and learner performance. Available: http://www.education.gov.za/LinkClick.aspx?fileticket=Jaaol0vqeR4%3d&tabid=36 • Gustafsson, M. (2013) The when and how of leaving school: The policy implications of new evidence on secondary schooling in South Africa. Stellenbosch Economic Working Papers 09/11. Available: http://www.ekon.sun.ac.za/wpapers/2011/wp092011
Thank youPresentation available at www.nicspaull.com/research
Figure 13: Matric pass rates as a percentage of Grade 2 enrolments 10 years earlier for selected provinces – see Taylor (2012: p. 9)
Conclusion • Ensuring that public funding is actually pro-poor and also that it actually reaches the poor. • Understanding whether the motivation is for human dignity reasons or improving learning outcomes. • Ensuring that additional resources are allocated based on evidence rather than anecdote. • The need for BOTH accountability AND capacity.
“The left hand barrel has horizontal wooden slabs, while the right hand side barrel has vertical slabs. The volume in the first barrel depends on the sum of the width of all slabs. Increasing the width of any slab will increase the volume of the barrel. So a strategy on improving anything you can, when you can, while you can, would be effective. The volume in the second barrel is determined by the length of the shortest slab. Two implications of the second barrel are that the impact of a change in a slab on the volume of the barrel depends on whether it is the binding constraint or not. If not, the impact is zero. If it is the binding constraint, the impact will depend on the distance between the shortest slab and the next shortest slab” (Hausmann, Klinger, & Wagner, 2008, p. 17).
BasicLiteracy and Numeracy (Gr 6) • What proportion of South African grade 6 children were functionally literate and functionally numerate? • Functionally illiterate: a functionally illiterate learner cannot read a short and simple text and extract meaning. • Functionally innumerate: a functionally innumerate learner cannot translate graphical information into fractions or interpret everyday units of measurement.
SACMEQ III (Spaull & Taylor, 2012) Literacy Numeracy