Download
1 / 1
20 likes | 220 Views
MATHEMATICAL MODELLING OF POPULATION DYNAMICS IN THEORETICAL ECOLOGY. Department of Mechanical Engineering and Mathematical Sciences. HARRY GREEN. Supervisors: DR. CRISTIANA SEBU, PROF. KHALED HAYATLEH, DR. TIM SHREEVE.

E N D
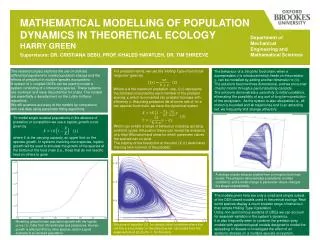
MATHEMATICAL MODELLING OF POPULATION DYNAMICS IN THEORETICAL ECOLOGY Department of Mechanical Engineering and Mathematical Sciences HARRY GREEN Supervisors: DR. CRISTIANA SEBU, PROF. KHALED HAYATLEH, DR. TIM SHREEVE For predation terms, we use the ‘Holling Type II functional response’ given by The research project explores the use of ordinary differential equations to model population change and the effects of predation in multiple species ecosystems. A system of coupled ODEs can be used to model a system consisting of interacting species. These systems are nonlinear and have the potential for chaos. The models are essentially a development on the Lotka-Volterra equations. We will examine accuracy of the models by comparison with real data using parameter fitting algorithms. The behaviour of a tritrophic food chain, when a superpredator is introduced which feeds on the predator , can be modelled by adding another dimension to . The solutions become three dimensional, and we encounter chaotic motion through a period doubling cascade. The solutions demonstrate a sensitivity to initial conditions, eliminating the possibility of any sort of long term prediction of the ecosystem. As the system is also dissipative i.e., all motion is bounded and all trajectories end in an attracting set, we frequently find strange attractors. Where a is the maximum predation rate. represents the biomass consumed by each member of the predator species y, which is converted into predator biomass with efficiency c. Assuming predators die at some rate d, for a two species food chain, we have the dynamical system - To model single isolated populations in the absence of predation or competition we use a logistic growth curve given by Which can exhibit a range of behaviour including spiraling and limit cycles. Bifurcation theory can reveal the existence of a Hopf Bifurcation and show for which parameter values the species can co-exist. The stability of the fixed point at the point determines the long term survival of the predator. Modelling Human population growth with the logistic curve (1). Data from UN estimates where is the carrying capacity, an upper limit on the species growth. In systems involving more species, logistic growth will be used to simulate the growth of the species at the bottom of the food chain (i.e., those that do not need to feed on others to grow. A strange chaotic attractor plotted from a tritrophic food chain model. The attractor demonstrates a sensitivity to initial conditions, and a small change in parameter values changes the shape unpredictably The models given here are only a small and simple subset of the ODE based models used in theoretical ecology. Real world species display a much broader range of behaviour than simple Holling Type II predation. Using non-autonomous systems of ODEs we can account for seasonal variation in the system’s dynamics. It is also frequently seen to combine the predator-prey models with epidemiological models designed to model the spreading of disease to investigate the effect of an epidemic disease on a multiple-species ecosystem. Modelling Human population growth with the logistic curve (1). Data from UN estimates Modelling global human population growth with the logistic curve . Data from UN estimates and predictions. Human growth is affected little by other species, and is a good example of an isolated population. Solutions of equation for various initial conditions where the red line is a boundary on the attracting set, calculated from the eigenvectors at (K for this plot).