Download
1 / 50
500 likes | 620 Views
The Fate of the Land Carbon Sink. Stephen W. Pacala Director, Princeton Environmental Institute Petrie Professor of Ecology. Failure of US climate legislation has condemned all of us to 10 years of additional delay. 450 ppmv is now not feasible. 500 ppmv is closest feasible target.

E N D
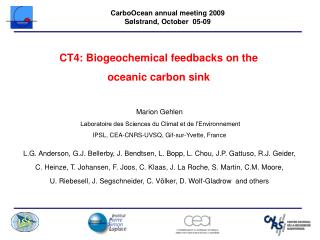
The Fate of the Land Carbon Sink Stephen W. Pacala Director, Princeton Environmental Institute Petrie Professor of Ecology
Failure of US climate legislation has condemned all of us to 10 years of additional delay. 450 ppmv is now not feasible. 500 ppmv is closest feasible target. 550 ppmv is more likely even if we succeed at the next likely opportunity.
Catastrophe from a global failure of CO2 fertilization at double pre-industrial CO2. Shevliakova et al. PNAS (2011) +218Pg - 444Pg Fertilization Persists Fertilization Fails
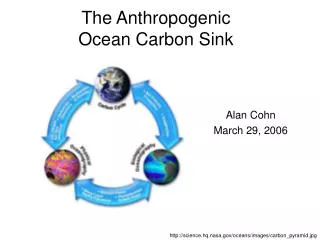
Key Diagnostic of the Carbon Cycle Evolution of the fraction of total emissions that remain in the atmosphere 10 Total CO2 emissions 8 CO2 Partitioning (PgC y-1) 6 Atmosphere 4 2 1970 1980 2010 2000 1960 1990 Data: NOAA, CDIAC; Le Quéré et al. 2009, Nature Geoscience
1.4 PgC y-1 4.1 PgC y-1 45% 3.0 PgC y-1 29% + 7.7 PgC y-1 26% 2.3 PgC y-1 Fate of Anthropogenic CO2 Emissions (2000-2008) Le Quéré et al. 2009, Nature Geoscience; Canadell et al. 2007, PNAS, updated
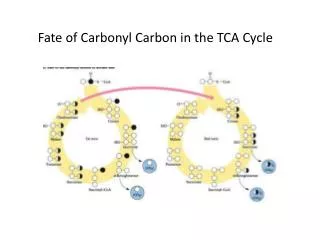
Pan et al. 2011 Science 333. Synthesis of global forest inventory data. Roughly half the missing sink is due to CO2 fertilization. The other half is due to land use. The land use sink will diminish through time. What about the CO2 sink?
Physiology of CO2 Fertilization Le Chatelier's principle: 6CO2 + 6H2O C6H12O6 + 6O2 Increased water use efficiency: Less stomatal opening needed for the same flux of CO2 in = less water loss per carbon gained.
The sink caused by CO2 fertilization should be: • Impeded by N-limitation • (Liebig’s Law of the • Minimum). • 2. Favored by water limitation. Water Nitrogen
Predictions of Global Biosphere Models Energy, water and carbon exchange Vegetation dynamics Climate statistics t~ 30 min Atmosphere Carbon gain leaves fine roots Phenology, t~ 1 month Canopy and canopy air Energy and moisture balance Carbon uptake and release labile Photosynthesis Plant and soil respiration Land-use management, t ~ 1 year Biogeography, t ~ 1 year Mortality, natural and fire t ~ 1 year Carbon allocation and growth, t ~ 1 day Plant type LAI, height, roots sapwood Soil/snow wood LM3V: Shevliakova, Milly, Pacala, Malyshev, Hurtt, Stoffer and many others.
Will the sink fail? Current models of the global biosphere uniformly predict a large and persistent CO2 fertilization sink. All models predict the water use efficiency benefit. Many models lack an N cycle so they could not predict that N-limitation will stop the sink. Those with an N cycle predict a sustained sink in the tropics because of N-fixing trees, and a weak or absent sink, because of Liebig’s Law, where N-fixers are absent.
CO2 fertilization is predicted to be N-limited in the high latitudes because of the absence of symbiotic N-fixing trees. Gerber et al. GBC 2009. Effects of N cycle on residual sink (C-only minus C-N)
But modern models of the global biosphere are extraordinarily complicated… • “The danger in creating fully detailed models of complex systems is ending up with two things you don’t understand – the model and the system.” Phillip England. Nature (2011) 469:38. • “Give me four free parameters and I’ll make you and elephant. Give me a fifth and I make it wiggle its trunk.” Attributed to J. von Neumann by Freeman Dyson. Nature (2004) 427.
Never have so many been asked to predict so much while knowing so little… • 100’s of operational decisions = 100’s of free parameters in global biosphere models. • If not for the crisis, I wouldn’t be ready to build such a model for many decades or a century or more. • To design LM3, I had to loosen the scientific standards I use elsewhere.
tuning Then why do global biosphere models seem to get the right answer? Cornucopia when independent models leave the tuning data Friedlingstein et al. 2006. J. Climate 19: 3337–3353.
What do experiments tell us? Duke FACE plus > 2 dozen others.
Norby et al. 2011 Ann Rev Eco. Syst. 42.: Some FACE experiments show a persistent sink from enhanced wood growth (i.e. Duke) while others show a weak sink because trees invest primarily in short–lived tissues, especially fine roots (ORNL). NPP is enhanced despite N-limitation. Penulas et al. 2011 Global Ecology and Biogeography: Tree wood growth has not been enhanced because of water saved.
Will the sink fail? Global models correctly predict the CO2 fertilization of net photosynthesis seen in the Face experiments. However, because they simply apply leaf-level relationships to the globe, they predict neither the observed persistence of the sink under N limitation nor the absence of the sink under water limitation. Instead they predict the opposite. The problem must be in the scaling: the extrapolation from leaf to grid cell.
Correct Scaling in Forest Stand Simulators Mountain Pine Beetle Infestation of >160,000 km2 mixed conifer forest in British Columbia Dendroctonus ponderosae Expected to reach ~375,000 km2 and release ~270 MtC (Kurz et al. 2008. Nature 452:887-890).
Strategies to sustain the forest economy. Salvage logging for < 15 years. Regenerated pine after 35-50 years. Economic collapse and depopulation from 15-35+ years. • In many stands, saplings of interior spruce and subalpine fir survive as advance regeneration. • Could these produce new spruce/fir stands that would fill the gap?
SORTIE and subsequently other forest stand simulators said yes. Empirical studies of natural successional sequences confirmed. Law passed in June 2008 prohibiting salvage logging of stands above a model-calculated threshold of spruce/fir advance regeneration.
Analytically Tractable Stand Simulator (Strigul et al. 2008. Ecol. Mono. 78 (4): 523-545) Let canopy height z* be defined by: where Ni (z,t) is the density of trees of species-i and height z at time t and αi(z*,z) is the tree’s crown area at height z*. Then:
Analytics: Equilibrium: Stability criterion: always met for reasonable parameters.
Analytical Condition for the Success of a Rare invading Species in an Equilibrium Monoculture of a Resident Species. Adams et al. (2007), Strigul et al. (2008) Species-i can invade species-j if : Species-j can invade species-i if :
Forests in the Minnesota, Wisconsin and Michigan. Purves et al. (2008A,B) FIA Forest Inventory Data Fit Predict Individual Growth Mortality Stand Successional Chronosequence basal area stand age
change in basal area from 15 to 100 years change in basal area 8 most common species Purves, Lichstein, Strigul, & Pacala. 2008. PNAS
change in basal area from 15 to 100 years xeromesic hydromesic mesic Too Little Cedar, Too Much Black Ash and Red Maple Red Maple Paradox Abrams (1998) species Purves, Lichstein, Strigul, & Pacala. 2008. PNAS
If the model is correct: Lichstein, Purves, & Pacala (in preparation) On mesic soils, red maple should be gaining on sugar maple. On wet soils, red maple and black ash should be gaining on cedar.
light water nitrogen CO2 temp. • physiology: • photosynthesis • respiration • individual: • growth • mortality • ecosystem: • biomass • NPP current PPA next-generation global model
Rain E&T Light N Deposition & Fixation ESS Analysis: VMAX Specific Leaf Area Leaf Longevity Leaf Nitrogen Wood density Height Allometry Crown Allometry LAI Fine root area Fecundity Carbohydrate Storage Seed size Litter Chemistry Crown Area = αcDν Photosynthesis & Transpiration Submodels Height = αzDν-1 Stem Mass = αsDν+1 Litter Root Uptake Submodels Soil Water Hydrology Submodel N-Cycling Submodel
Optimal Strategies Meritocracy Fitness Plant Strategy
Competitive strategies Invader successful Tournament With No Fair Play. Invasion Potential Resident Invader unsuccessful
Competitive strategies Invader successful Tournament With No Fair Play. Invasion Potential Resident Invader unsuccessful
Competitive strategies Invader successful Tournament With No Fair Play. Invasion Potential Resident Invader unsuccessful Ecologically or evolutionarily stable strategy
Empirical Fingerprints of Competitive Equilibrium Gersani et al. 2001 – Soybean plants
1. As N-availability changes: No tradeoff between leaves and roots, but a dramatic tradeoff between wood and roots. Dybzinski et al. (2010) Points = FLUXNET data Lines = Model predictions ESS Predictions
2. Complex results from simple experiments. (Farrior, Tilman and Pacala, in prep.) • Leaves increase with N • Water and N have a significant interaction • Roots increase with water addition * * * * ESS Predictions
3. As N-mineralization increases, leaf N increases within each species, but leaf N of the dominant species decreases (Dybzinski et al. in review). 4. N-fixing canopy trees are common in the tropics but absent at higher latitudes, even though temperate and boreal ecosystems are thought to be the most N-limited. ESS Predictions
So what does the model predict about the effects of nitrogen and water limitation on a CO2 fertilization sink?
Add fines root to rare invader that competes better for N. • Build more leaf with extra N (most shaded leaf). • If carbon gain from new leaf > cost of new root + new leaf then: Light + C-gain Nitrogen More N
Replace resident strategy with invader . • Repeat until the cost of a change in strategy is always less than benefits. Nitrogen Limited ESS = fine roots that exactly cancel the net carbon gain of the most shaded leaf.
Prediction for CO2 Fertilization with Limited N (Dybzinski et al. in prep.) Elevated CO2 increases net photosynthesis, increasing the value of the most shaded leaf. Competitive optimal strategy is to add fine roots that exactly cancel this value. Extra investment in new fine roots is small if the understory is dark because the most shaded leaf has little value. Most extra C goes to wood, so big sink. Reverse if understory is light. Then most extra C goes to short-lived fine roots, so small sink.
Prediction for CO2 Fertilization with limited N – a Weakening of Liebig’s Law Elevated CO2 creates a large long-lived sink if LAI is relatively large (understory is dark), but not if LAI is relatively small. LAI increases with N-mineralization. Extra C goes mostly to wood. Extra C goes mostly to fine roots. Severe Present N-limitation
Add root to rare invader that competes better for water. • Photosynthesis is proportional to transpiration. • If carbon gain from extra photosynthesis > cost of new root then: Light Extra C-gain Prop. to Extra Water Water More Water
Replace resident strategy with invader . • Repeat until the cost of a change in strategy is always less than benefits. Water Limited ESS = roots that exactly cancel the net carbon gain of the ENTIRE CANOPY during water-limited periods.
Prediction for CO2 Fertilization with Limited Water (Farrior et al. in prep.) Elevated CO2 increases net photosynthesis, increasing the value of EVERY leaf. Competitive optimal strategy is to add fine roots, whose cost exactly cancels this increase in value. Thus all of the extra carbon from CO2 fertilization during periods of water limitation goes to short lived fine roots and does not create a large sink.
Conventional Wisdom: Sustained carbon sinks caused by CO2 fertilization are more likely if water is limiting and less likely if nitrogen is limiting. Our Model Predictions: Exactly the opposite.
Norby et al. 2011 Ann Rev Eco. Syst. 42.: NPP is enhanced in FACE experiments despite N-limitation. Some FACE experiments exhibit a strong persistent sink because of increased wood growth and limited fine root proliferation despite N-limitation. Others show a weak sink and have large fie root proliferation. Penulas et al. 2011 Global Ecology and Biogeography: Tree wood growth has not been enhanced because of water saved.
What does this mean for the globe? The answer depends upon the mix of water limitation, severe N-limitation and relatively weak N-limitation. My guess is that sites that N-limited sites with relatively high LAI are responsible for most global NPP. If so, we predict a long-lived global sink.
CONCLUSIONS • The future of humanity literally depends upon the future of the carbon sink. • Existing global models do not predict the observed failure of the sink under water limitation and the persistence of the sink under nitrogen limitation. • The observed responses are predicted as the most competitive strategies (Nash Equilibria). • These strategies happily imply a large and long-lived global benefit from CO2 fertilization.