Download
1 / 22
250 likes | 545 Views
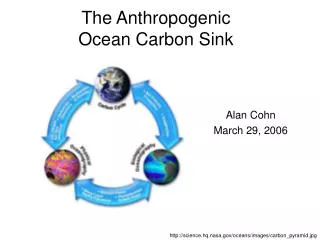
The Anthropogenic Ocean Carbon Sink. Alan Cohn March 29, 2006. http://science.hq.nasa.gov/oceans/images/carbon_pyramid.jpg. Due to oceanic and land sinks, less than 1/2 of CO 2 emissions from industrial period remain in atmosphere.

E N D
The Anthropogenic Ocean Carbon Sink Alan Cohn March 29, 2006 http://science.hq.nasa.gov/oceans/images/carbon_pyramid.jpg
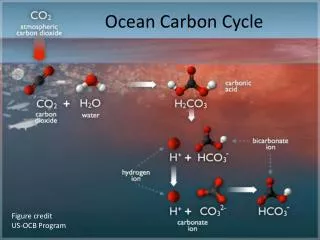
Due to oceanic and land sinks, less than 1/2 of CO2 emissions from industrial period remain in atmosphere. • How much is due to land sink and how much is due to ocean sink? • How have sinks changed over time and how will they change in future? http://upload.wikimedia.org/wikipedia/en/5/55/Carbon_cycle-cute_diagram.jpeg
O2/N2 technique used in 2001 IPCC report has come under scrutiny due to inconsistencies in observed oceanic oxygen concentrations with CO2 inventory. • More recent efforts have based CO2 inventories on “age” of water, carbonate chemistry
McNeil et al. (2003) used CFC concentrations to estimate age of water masses • Problems with this method. • CFCs around for limited time dating prior to ~30yrs impossible • Don’t account for Revelle factor
Revelle factor is defined as • Describes how partial pressure of CO2 in seawater changes for a given change in DIC • Proportional to ratio btwn DIC and alkalinity (oceanic charge balance). • Low Revelle factors generally in warm tropical and subtropical waters • High Revelle factors in cold high latitude waters
Sabine et al. (2004) used direct measurements of DIC to assess changes in anthropogenic ocean CO2 • Used carbon tracer ∆C* method to separate anthropogenic component http://www.sciencemag.org/cgi/content/full/sci;305/5682/367
North Atlantic had highest vertically integrated CO2 concentrations with 23% of global oceanic CO2 • Mostly due to the rapid sinking of cold water http://www.sciencemag.org/cgi/content/full/sci;305/5682/367
Southern Ocean south of 50°S only contains 9% of global inventory • Southern Hemisphere oceans, however, contain about 60% of total oceanic CO2 inventory, mostly due to immense area http://www.sciencemag.org/cgi/content/full/sci;305/5682/367
Highest concentrations of anthropogenic CO2 are found near surface, since CO2 enters ocean by air-sea gas exchange • Variations in surface CO2 concentration related to how long water has been exposed to atmosphere and Revelle factor
Capacity for ocean waters to take up anthropogenic CO2 is inversely related to the Revelle factor • Highest anthropogenic CO2 concentrations found in subtropical Atlantic due to low Revelle factor • North Pacific has high Revelle factor lower anthropogenic CO2 concentrations
Revelle factor limits uptake so that ocean CO2 inventory is significantly lower than what it would be if one was to neglect its influence
CO2 concentrations at depth determined by how rapidly near-surface anthropogenic CO2 is transported into the ocean interior • Transport occurs along surfaces of constant density, or isopycnals • Deepest penetration at mid-latitude convergence zones • Low vertical penetration in upwelling regions like equatorial Pacific Atmospheric CO2 concentration when water was last in contact with surface also important
High anthropogenic CO2 concentrations off Antarctica due to: • High winds • Low initial anthropogenic CO2 content of water • Rapid sinking Deepwater has low concentrations because: • High Revelle factor • Limited contact with surface • Dilution with older waters
Sabine et al. suggest that land has been net source while ocean is only true net sink • They estimate atmospheric CO2 would be about 55ppmv higher today if it weren’t for oceanic uptake • What if oceanic uptake slows down? http://www.windows.ucar.edu/earth_science/images/ocean_currents1.jpg
Already, there are signs of slowing • Uptake fraction has decreased from 28-34% to ~26% • Ocean has slow mixing time may not be able to “keep up” with emissions • If given thousands of years, ocean would uptake ~90% • Positive and Negative feedbacks may take effect
Negative feedbacks are mostly chemical • Warming More stratification Transport into the interior slows down • McNeil et al. suggest that this will not have much effect on oceanic uptake • Chemical: Greater PCO2 of surface ocean Decrease in carbonate ion concentration Increase in Revelle factor decreased ability to absorb CO2
Fung et al. modeled future oceanic uptake using 2 different emissions scenarios • Includes simplified form of solubility carbon pump, organic and inorganic carbon pump, and air-sea CO2 flux • Scenario A1B: Balanced energy sources • Fossil Fuel emissions increase until 2050, then decrease • Scenario A2: Business-as-usual • Emissions increase exponentially
In balanced energy sources model, mixing of CO2 in deep ocean maintains slower surface CO2 increase Oceanic sink steadily increases Atmospheric CO2 concentrations in 2100 of 661 ppmv Temperature increase of 1.21 K Oceanic CO2 fraction in 2100, compared to land & airborne CO2, is 24%
In business-as-usual scenario, carbon sequestration in land and ocean can’t keep up with emissions Capacity of sinks decreases as CO2 increases. Atmospheric CO2 concentrations in 2100 of 792 ppmv Temperature increase of 1.42 K Oceanic CO2 fraction in 2100 is 21%
Models did not include an increasing Revelle factor! • Their results were based on a slowed ocean circulation • Also accounted for increased biological uptake Difference between coupled and uncoupled carbon-climate system (gC/m2) http://www.pnas.org/cgi/content/full/102/32/11201
Because they did not account for the Revelle factor, they may have overestimated oceanic uptake and underestimated atmospheric CO2 concentrations! More model studies are need that account for ocean acidification Caldeira & Wickett, Nature, 2003
References Fung et al. (2005) Evolution of carbon sinks in a changing climate. PNAS, 102, 11201-11206. Gruber, N., Sarmiento, J.L., and T. Stocker (1996) An improved method for detecting anthropogenic CO2 in the oceans, Global Biogeochemical Cycles, 10, 809-837. Houghton et al. (2001) Climate Change 2001: Synthesis Report, Cambridge Univ. Press, Cambridge, U.K. McNeil et al. (2003) Anthropogenic CO2 Uptake by the Ocean Based on the Global Chlorofluorocarbon Data Set, Science, 299, 235-239. Sabine et al. (2004) The Oceanic Sink for Anthropogenic CO2, Science, 305, 367-371.