Download
1 / 1
10 likes | 120 Views
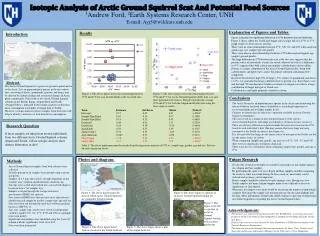
1 Andrew Ford, 2 Earth Systems Research Center, UNH E-mail: Ayj5@wildcats.unh.edu. Explanation of Figures and Tables: Figure 1 displays the significant difference in δ 15 N between the two field sites .

E N D
1Andrew Ford, 2Earth Systems Research Center, UNH E-mail: Ayj5@wildcats.unh.edu • Explanation of Figures and Tables: • Figure 1 displays the significant difference in δ15N between the two field sites. • Figure 2 shows where the Toolik and Atigun site averages fall on a δ15N vs. δ13C graph relative to food sources and hair. • There were no clear relationships between δ13C, %N, %C and C/N when analyzed against age, site, sample type and gender. • There were also no clear relationships between δ15N when analyzed against age, sample type and gender. • The large difference in δ15N between the scat at the two sites suggests that the protein source of individuals at each site varied, whereas the lack of a difference in δ13C suggested that bulk carbon (presumably carbohydrates) did not differ. • Protein, is a major component of the Arctic Ground Squirrel diet, along with carbohydrates and lipids (fats), and is the primary nitrogen-containing food component. • Based on the relatively high %N of fungi (~3%) relative to graminoids and dicots (1-2%), we conclude that fungi contribute more to protein (e.g., hair) than to scat, and the high 15N enrichment of Toolik scat relative to Atigun scat reflects a large contribution of fungal nitrogen to Toolik scat. • Carbohydrates and lipids primarily contribute carbon. Results | | | | | | | | | | | | | | Isotopic Analysis of Arctic Ground Squirrel Scat And Potential Food Sources Abstract: The Arctic Ground Squirrel is a species of ground squirrel native to the Arctic. It is an important prey species in the area whose diet, consisting of dicots, graminoids (grasses) and fungi, may be affected by climate change and associated changes in Arctic plant communities. Prior work at two Arctic Ground Squirrel colonies in the Brooks Range, Atigun (Red) and Toolik (Orange/Yellow), indicated from isotopic analyses on hair that dicot consumption was higher at Atigun than at Toolik. However, isotopic analysis of feces samples from both sites will help to identify variations (or lack thereof) in consumption. Figure 1: The above figure shows the relationship between δ15N and δ13C for scat of individuals at the two field sites. Figure 2: The above figure shows the relationship between δ15N and δ13C for Arctic Ground Squirrel (AGS) hair, scat and three potential food sources. The plot includes the average δ15N and δ13C for both the Atigun and Toolik sites using the feces analysis results. • Conclusions • The Arctic Ground is an important prey species in the Arctic and monitoring the species behavior and food source availability is accordingly important to ecosystem health and to higher trophic levels • Changes in climate directly affect the vegetation available in Arctic Ground Squirrel communities. • This may result in a change in diet and performance of the species. • Arctic Ground Squirrels will adapt accordingly to obtain necessary resources. • There are obvious differences in protein intake between sites based on the δ15N found in each individual’s diet. One may assume that more fungi are being consumed at the Toolik site than at the Atigun site. • It is also possible that fungi are the major source of nitrogen at the Toolik site but not the major source of carbon. • When comparing sample type, gender, age and site to δ13C, %N, %C and C/N there were no significant correlations displayed. • There were also no correlations when comparing sample type, gender, and age to δ15N. Term Estimate Std Error t Ratio Prob>|t| Intercept 2.17 0.45 4.81 <.0001* Sample Type[Fine] 0.35 0.36 0.97 0.3389 Sample Type[Mix] 0.14 0.32 0.43 0.6683 Gender[f] 0.48 0.41 1.17 0.2524 Gender[m] -0.29 0.39 -0.74 0.4644 Age[Adult] 0.79 0.57 1.39 0.1757 Age[juvenile] -0.54 0.53 -1.03 0.3132 Age[unknown] -0.002 0.57 -0.00 0.9971 Site[Atigun] -2.18 0.44 -4.96 <.0001* Site[Toolik] 4.15 0.72 5.78 <.0001* Research Question If feces samples are taken from several individuals from two different Arctic Ground Squirrel colonies, Atigun and Toolik, will an isotopic analysis show distinct differences in diet? Introduction Table 1: The above table represents the results from the regression analysis of δ15N vs. sample type, gender, age and site. Site was the only significant factor. Photos and diagram: • Future Research • To take this research even further it would be a good idea to run similar analyses on collagen and hair samples. • By performing the same tests on collagen and hair samples and then comparing the results to what was found during the feces analysis, uncertainty can be reduced and accuracy can be improved. • Future samples should be collected evenly amongst sites. Having very few Toolik samples and many Atigun samples made it very difficult to discover significance or lack thereof. • What may also improve the study would be increasing the number of individuals sampled. The larger the sample size the more precise the data and findings will become. More information will provide added evidence to proving or disproving any further hypotheses regarding the Arctic Ground Squirrel diets. Methods • Arctic Ground Squirrel samples from both colonies were collected. • Sizeable portion of all samples were ground using a mortar and pestle. • Samples (4-4.5 mg) and controls (weight dependent on the content) were weighed and divided into small tin cup. • Tin cups were sealed and crushed into a closed ball shape to be placed into a 5x9 samples tray. • Samples were put through the isotope ratio mass spectrometer (IRMS) for analysis. • Data from the IRMS were then put into excel spreadsheets identifying each sample by gender, sample type, age and site. • Data were then ran through the analytical software package known as JMP Pro 11. • Age, site, sample type, gender were tested as independent variables against %N, %C, δ13C, δ15N and C/N in a multiple regressionmodel. • Significant relationships were identified using the “prob>|t|” column with the significance level set at 0.05. • Data were then interpreted. Figure 3: The above figure marks the areas in which Arctic Ground Squirrels are commonly found in Alaska Figure 6: The above figure is a picture of an Arctic Ground Squirrel looking for danger. Figure 7: The figure to the left is a picture of an Arctic Ground Squirrel feeding on Leccinummushroom • Acknowledgements • This project was supervised and monitored by Dr. Erik Hobbie, a research associates professor of the University of New Hampshire’s Institute for the Study of Earth, Ocean and Space. • Data for this research was collected by Julee Shamhart, a UNH masters student in the Natural Resources Department. • The data was processed through the mass spectrometer by Janet Chen, Postdoctoral Associate and Isotope Laboratory Manager at the University of New Hampshire. Figure 4: The above figure shows burrows located at the Toolik field site. Figure 5: The above figure shows a plot of the Atigun field site.