LINE graphs
LINE graphs. SPI 0406.5.1 & SPI 0406.5.3 SPI 0506.5.1 & SPI 0506.5.3. I can depict data using tables and line graphs I can describe the distribution of data in table or graph using median, range, and mode. . What is a line graph?. 1) A line graph is used to show data .


LINE graphs
E N D
Presentation Transcript
LINE graphs SPI 0406.5.1 & SPI 0406.5.3 SPI 0506.5.1 & SPI 0506.5.3
I can depict data using tables and line graphs • I can describe the distribution of data in table or graph using median, range, and mode.
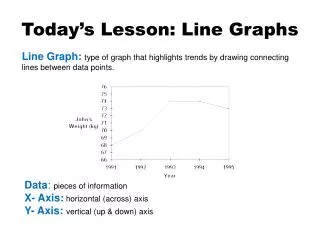
What is a line graph? 1) A line graph is used to show data. 2) A line graph is used to show changes over time. 3) A line graph can show functions. http://www.mathgoodies.com/lessons/graphs/line.html
RANGE Find the point that is the GREATEST Find the point that is the least…… greatest – least =range
What was the range for the height of the plant? Find the point that is the GREATEST Find the point that is the least…… greatest – least = range
Greatest – least = range Greatest height = 15 cm Least height = 3 cm 15– 3 =? 12 cm
TEACHERS…. • PRINT THE NEXT TWO SLIDES FOR STUDENTS TO CREATE A LINE GRAPH.
Teachers’ TV Time 14 13 12 11 10 9 8 7 6 5 4 3 2 1 Tues. Wed. Thur. Fri. Sat. Sun. Mon.
STUDENTS: • COMPARE THE GRAPH YOU CREATED TO THIS ONE TO SEE IF YOU PLOTTED YOUR DATA CORRECTLY.
Teachers’ TV Time 14 13 12 11 10 9 8 7 6 5 4 3 2 1 Tues. Wed. Thur. Fri. Sat. Sun. Mon.
Teachers’ TV Time 14 13 12 11 10 9 8 7 6 5 4 3 2 1 Tues. Wed. Thur. Fri. Sat. Sun. Mon.
Teachers’ TV Time 14 13 12 11 10 9 8 7 6 5 4 3 2 1 Tues. Wed. Thur. Fri. Sat. Sun. Mon.
Teachers’ TV Time 14 13 12 11 10 9 8 7 6 5 4 3 2 1 Tues. Wed. Thur. Fri. Sat. Sun. Mon.
Teachers’ TV Time 14 13 12 11 10 9 8 7 6 5 4 3 2 1 Tues. Wed. Thur. Fri. Sat. Sun. Mon.
Teachers’ TV Time 14 13 12 11 10 9 8 7 6 5 4 3 2 1 Tues. Wed. Thur. Fri. Sat. Sun. Mon.
Teachers’ TV Time 14 13 12 11 10 9 8 7 6 5 4 3 2 1 Tues. Wed. Thur. Fri. Sat. Sun. Mon.
#1: On which day did the teachers watch the most TV? • A. Monday • B. Wednesday • C. Thursday • D. Friday
#1: On which day did the teachers watch the most TV? • A. Monday • B. Wednesday • C. Thursday • D. Friday
#2: How many hours of TV were watched in all? • A. 12 • B. 40 • C. 33 • D. 34
#2: How many hours of TV were watched in all? • A. 12 • B. 40 • C. 33 • D. 34
RANGE Find the point that is the GREATEST Find the point that is the least…… range = greatest - least
#3: What was the range for the amount of TV that was watched by the teachers? • A. 11 hours • B. 10 hours • C. 12 hours • D. 13 hours
Let’s find the range of the teachers’ TV time: • Greatest = 12 hours • Least = 1 hour • Greatest –least • 12 – 1 = 11
#3: What was the range for the amount of TV that was watched by the teachers? • A. 11 hours • B. 10 hours • C. 12 hours • D. 13 hours
$125 $100 $75 $50 $25 $50 $0
#1: On what day did Mrs. Swope have $75? • A. Tuesday • B. Wednesday • C. Thursday • D. Friday
#1: On what day did Mrs. Swope have $75? • A. Tuesday • B. Wednesday • C. Thursday • D. Friday
The rule of the pattern? • Does the same thing happen each day? • What happens each day to Mr. Fenimore’s bank account?
#2: What is the rule of the pattern? • A. Add 50 • B. Add 25 • C. Subtract 50 • D. Subtract 25
#2: What is the rule of the pattern? • A. Add 50 • B. Add 25 • C. Subtract 50 • D. Subtract 25
#3: If the pattern continues, how much money will Mrs. Swope have in her account on Sunday? • A. $150 • B. $175 • C. $200 • D. $225
#3: If the pattern continues, how much money will Mrs. Swope have in her account on Sunday? • A. $150 • B. $175 • C. $200 • D. $225
Look at the graph below. How many more gizmos were sold in May than in February? • A. 1000 gizmos • B. 2000 gizmos • C. 3000 gizmos • D. 4000 gizmos
Look at the graph below. How many more gizmos were sold in May than in February? • A. 1000 gizmos • B. 2000 gizmos • C. 3000 gizmos • D. 4000 gizmos 4,000 – 3,000 =
Look at the graph below. How many more gizmos were sold in May than in February? • A. 1000 gizmos • B. 2000 gizmos • C. 3000 gizmos • D. 4000 gizmos 4,000 – 3,000 =
Tina collects aluminum cans to recycle. She graphs the number of pounds she collects each month. Which month of these six months shows the largest increase in pounds collected? • A. February • B. June • C. April • D. January
Tina collects aluminum cans to recycle. She graphs the number of pounds she collects each month. Which month of these six months shows the largestincrease in pounds collected? • A. February • B. June • C. April • D. January Increase
Tina collects aluminum cans to recycle. She graphs the number of pounds she collects each month. Which month of these six months shows the largestincrease in pounds collected? • A. February • B. June • C. April • D. January Increase
STRATEGIES TO SOLVE IF MARCH HAD BEEN A CHOICE….. Step 1: Look for the months when there was an increase. Step 2: Figure how much of an increase for each of those months. Feb. to March increase = 15 lbs. May to June increase = 20 lbs.
Jana's last seven test scores were 85, 90, 90, 80, 75, 80, and 80 respectively.How should she find the average (mean) of her scores? • A. Add the seven scores together and divide by the most common number. • B. Find the number that appears the most. • C. Add the seven scores together and divide by 7. • D. Multiply each score by 7.
Jana's last seven test scores were 85, 90, 90, 80, 75, 80, and 80 respectively.How should she find the average (mean) of her scores? • A. Add the seven scores together and divide by the most common number. • B. Find the number that appears the most. • C. Add the seven scores together and divide by 7. • D. Multiply each score by 7.
Jana's last seven test scores were 85, 90, 90, 80, 75, 80, and 80 respectively.What is the mode of her test scores? • A. 90 • B. 85 • C. 80 • D. 75
REMEMBER!!! MODE = MOST OFTEN
Jana's last seven test scores were 85, 90, 90, 80, 75, 80, and 80 respectively.What is the mode of her test scores? • A. 90 • B. 85 • C. 80 • D. 75