Graphing: Line Graphs
Graphing: Line Graphs. A line graph is used to display data that show how the dependent variable changes in response to independent variable. The graph must have: The independent variable on the x axis. The dependent variable on the y axis.

Graphing: Line Graphs
E N D
Presentation Transcript
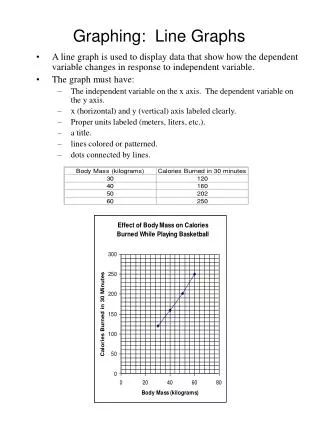
Graphing: Line Graphs • A line graph is used to display data that show how the dependent variable changes in response to independent variable. • The graph must have: • The independent variable on the x axis. The dependent variable on the y axis. • x (horizontal) and y (vertical) axis labeled clearly. • Proper units labeled (meters, liters, etc.). • a title. • lines colored or patterned. • dots connected by lines.
Your Assignment • You must make a line graph using the data below. Be sure to follow the guidelines on the front of this sheet.