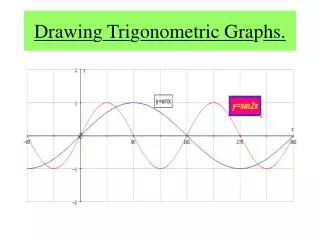
Drawin g Tri g onometric Gra p hs.
Drawin g Tri g onometric Gra p hs. The Basic Graphs. You should already be familiar with the following graphs:. Y = SIN X. Y= COS X. Y = TAN X . Chan g in g Trigonometric Gra p hs. You should know how the following graphs differ from the basic trigonometric graphs:. Y= 2 SIN X.

Drawin g Tri g onometric Gra p hs.
E N D
Presentation Transcript
The Basic Graphs. You should already be familiar with the following graphs: Y = SIN X
Changing Trigonometric Graphs. You should know how the following graphs differ from the basic trigonometric graphs: Y= 2 SIN X The 2 in front of the sin x changes the “amplitude”of the graph.
Y = 5 COS X As expected the amplitude of the graph is now 5. Hence the graph has a maximum value of 5 and a minimum value of –5.
Y = SIN 2X By introducing the 2 in front of the X , the “period” of the graph now becomes 360o 2 = 180o.
Y= COS 6X The period of the graph has now become 360o 6 = 60o as expected.
Y= SIN X + 1 The plus 1 has the effect of “translating” the graph one square parallel to the y axis.
Y = COS X - 5 The cosine graph is translated 5 squares downwards parallel to the y axis.
Y= – SIN X The minus sign in front of the function “reflects” the whole graph in the X axis.
Y = – COS X As expected the cosine graph is reflected in the X axis.
+k - k 360 K Summary Of Effects. (1) Y= K COS X & Y = K SINX The amplitude of the function is “K” . (2) Y = COS KX & Y = SIN KX The period of the function is “360 k” .
(3) Y= COS X + K & Y = SIN X + K +k - k Y = - COS X Translates the graph + K or – K parallel to the y axis. (4) Y = - COS X & Y = - SIN X. Reflects the graph in the x axis.
Combining The Effects. We are now going to draw more complex trigonometric graphs like the one shown above, by considering what each part of the equation does to the graph of the equation.
4 180o +3 y = 4 sin x Example 1. Draw the graph of : y = 4sin2x + 3 Solution. y = 4 sin 2x Draw the graph of : y = sin x y = 4sin 2x + 3
Example 2 72o 6 y = - 6cos5x Draw the graph y = 2 – 6 cos 5x Solution. Draw the graph of : y = cos x y = 2 – 6 cos 5x y= 6cos5x
+ 60o Creating A Phase Shift. Shown below is the graph of y = sin xo Now compare it with the graph of y= sin( x - 60o) The graph is translated 60o to the right parallel to the x axis.
-45o Shown below is the graph of y = cos x. Now compare it to the graph of y = cos ( x + 45o) The graph is translated 45o to the left parallel to the x axis.
y = cos (x-k) + ko y = cos x From the previous examples we can now see that the equation: y = cos ( x - k ) & y = sin ( x - k) translates the graph ko to the right parallel to the x axis. From the previous examples we can now see that the equation: y = cos ( x + k ) & y = sin ( x + k) translates the graph ko to the left parallel to the x axis.