Download

1 / 18
190 likes | 228 Views
Learn how to graph linear inequalities and apply to practical problems. Detailed procedures to sketch lines, shade regions, and find solution sets with examples.

E N D
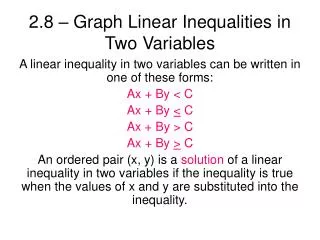
Chapter 5.1 Systems of linear inequalities in two variables. In this section, we will learn how to graph linear inequalities in two variables and then apply this procedure to practical application problems.
Graphing a linear inequality • Our first example is to graph the linear equality • The following is the procedure to graph a linear inequality in two variables: • Replace the inequality symbol with an equal sign • 2. Construct the graph of the line. If the original inequality is a > or < sign, the graph of the line should be dotted. Otherwise, the graph of the line is solid.
Continuation of Procedure • Since the original problem contained the inequality symbol (<) the line that is graphed should be dotted. For our problem, the equation of our line is already in slope-intercept form,(y=mx+b) so we easily sketch the line by first starting at the y-intercept of -1, then moving vertically 3 units and over to the right of 4 units corresponding to our slope of ¾. After locating the second point, we sketch the dotted line passing through these two points.
3. Now, we have to decide which half plane to shade. The solution set will either be (a) the half-plane above the line or (b) the half-plane below the graph of the line. To determine which half-plane to shade, we choose a test point that is not on the line. Usually, a good test point to pick is the origin (0,0), unless the origin happens to lie on the line. In this case, we choose the origin as a test point to see if this point satisfies the original inequality. Substituting the origin in the inequality produces the statement 0 < 0 – 1 or 0 < -1.Since this is a false statement, we shade the region on the side of the line NOT containing the origin. Had the origin satisfied the inequality, we would have shaded the region on the side of the line CONTAINING THE ORIGIN. Continuation of Procedure
Graph of Example 1 • Here is the complete graph of the first inequality:
Example 2 • For our second example, we will graph the inequality 1. Step 1. Replace inequality symbol with equals sign: 3x – 5y = 15 2. Step 2. Graph the line 3x – 5y = 15 Since 3 and -5 are divisors of 15, we will graph the line using the x and y intercepts: When x = 0 , y = -3 and y = 0 , x = 5. Plot these points and draw a solid line since the original inequality symbol is less than or equal to which means that the graph of the line itself is included.
Example 2 continued: • Step 3. Choose a point not on the line. Again, the origin is a good test point since it is not part of the line itself. We have the following statement which is clearly false. • Therefore, we shade the region on the side of the line that does not include the origin.
Example 3 : 2x > 8 • Our third example is unusual in that there is no y-variable present. The inequality 2x>8 is equivalent to the inequality x > 4. How shall we proceed to graph this inequality? The answer is the same way we graphed previous inequalities: • Step 1: Replace the inequality symbol with an equals sign. • x = 4. • Step 2: Graph the line x = 4. Is the line solid or dotted? The original inequality is > (strictly greater than- not equal to). Therefore, the line is dotted. • Step 3. Choose the origin as a test point. Is 2(0)>8? Clearly not. • Shade the side of the line that does not include the origin. The graph is displayed on the next slide.
Example 4: • This example illustrates the type of problem in which the x-variable is missing. We will proceed the same way. • Step 1. Replace the inequality symbol with an equal sign • y = 2 • Step 2. Graph the equation y = 2 . The line is solid since the original inequality symbol is less than or equal to. • Step 3. Shade the appropriate region. Choosing again the origin as the test point, we find that is a false statement so we shade the side of the line that does not include the origin. • Graph is shown in next slide.
Graphing a system of linear inequalities- Example 5 • To graph a system of linear inequalities such as • we proceed as follows: • Step 1. Graph each inequality on the same axes. The solution is the set of points whose coordinates satisfy all the inequalities of the system. In other words, the solution is the intersection of the regions determined by each separate inequality.
The graph is the region which is colored both blue and yellow. The graph of the first inequality consists of the region shaded yellow and lies below the dotted line determined by the inequality The blue shaded region is determined by the graph of the inequality and is the region above the line x – 4 = y Graph of example 5
Graph of more than two linear inequalities • To graph more than two linear inequalities, the same procedure is used. Graph each inequality separately. The graph of a system of linear inequalities is the area that is common to all graphs, or the intersection of the graphs of the individual inequalities.
Application • Before we graph this system of linear inequalities, we will present an application problem. Suppose a manufacturer makes two types of skis: a trick ski and a slalom ski. Suppose each trick ski requires 8 hours of design work and 4 hours of finishing. Each slalom ski 8 hours of design and 12 hours of finishing. Furthermore, the total number of hours allocated for design work is 160 and the total available hours for finishing work is 180 hours. Finally, the number of trick skis produced must be less than or equal to 15. How many trick skis and how many slalom skis can be made under these conditions? How many possible answers? Construct a set of linear inequalities that can be used for this problem.
Let x represent the number of trick skis and y represent the number o slalom skis. Then the following system of linear inequalities describes our problem mathematically. The graph of this region gives the set of ordered pairs corresponding to the number of each type of ski that can be manufactured. Actually, only whole numbers for x and y should be used, but we will assume, for the moment that x and y can be any positive real number. Remarks: Application x and y must both be positive Number of trick skis has to be less than or equal to 15 Constraint on the total number of design hours Constraint on the number of finishing hours See next slide for graph of solution set.