Download
1 / 34
340 likes | 374 Views
This talk by Jim Gray from Microsoft Research discusses the challenges and opportunities in building big data servers on the web. It covers topics such as data summarization, trend detection, and anomaly detection.

E N D
Building BIG Data Servers on the Web Talk at Flash Mob Supercomputer 3 April 2004 Jim Gray Microsoft Research Gray@Microsoft.com http://research.microsoft.com/~Gray
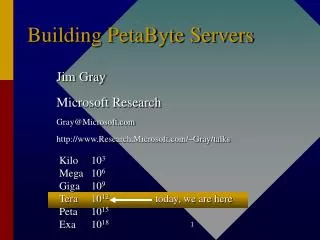
NumbersTeraBytes and Gigabytes are BIG! • Mega – a house in san francisco • Giga – a very rich person • Tera – ~ The Bush national debt • Peta – more than all the money in the world • A Gigabyte: the Human Genome • A Terabyte: 150 mile long shelf of books.
How much information is there? Yotta Zetta Exa Peta Tera Giga Mega Kilo Everything! Recorded • Soon everything can be recorded and indexed • Most bytes will never be seen by humans. • Data summarization, trend detection anomaly detection are key technologies See Mike Lesk: How much information is there: http://www.lesk.com/mlesk/ksg97/ksg.html See Lyman & Varian: How much information http://www.sims.berkeley.edu/research/projects/how-much-info/ All Books MultiMedia All books (words) .Movie A Photo A Book 24 Yecto, 21 zepto, 18 atto, 15 femto, 12 pico, 9 nano, 6 micro, 3 milli
e-Science • Data captured by instrumentsOr data generated by simulator • Processed by software • Placed in a files or database • Scientist analyzes files / database • Virtual laboratories • Networks connecting e-Scientists • Strong support from funding agencies • Better use of resources • Primitive today
The Big Picture Experiments & Instruments facts • Data ingest • Managing a petabyte • Common schema • How to organize it? • How to reorganize it • How to coexist with others questions facts ? Other Archives facts answers Literature facts Simulations The Big Problems • Query and Vis tools • Support/training • Performance • Execute queries in a minute • Batch query scheduling
e-Science is Data Mining • There are LOTS of data • people cannot examine most of it. • Need computers to do analysis. • Manual or Automatic Exploration • Manual: person suggests hypothesis, computer checks hypothesis • Automatic: Computer suggests hypothesis person evaluates significance • Given an arbitrary parameter space: • Data Clusters • Points between Data Clusters • Isolated Data Clusters • Isolated Data Groups • Holes in Data Clusters • Isolated Points Nichol et al. 2001 Slide courtesy of and adapted from Robert Brunner @ CalTech.
Data Analysis • Looking for • Needles in haystacks – the Higgs particle • Haystacks: Dark matter, Dark energy • Needles are easier than haystacks • Global statistics have poor scaling • Correlation functions are N2, likelihood techniques N3 • As data and computers grow at same rate, we can only keep up with N logN • A way out? • Discard notion of optimal (data is fuzzy, answers are approximate) • Don’t assume infinite computational resources or memory • Requires combination of statistics & computer science
TerraServer/TerraServicehttp://terraService.Net/ • US Geological Survey Photo (DOQ) & Topo (DRG) images online. • On Internet since June 1998 • Operated by Microsoft Corporation • Cross Indexed with • Home sales, • Demographics, • Encyclopedia • A web service • 20 TB data source • 10 M web hits/day
Digital OrthoQuads 18 TB, 260,000 files uncompressed Digitized aerial imagery 88% coverage conterminous US 1 meter resolution < 10 years old Digital Raster Graphics 1 TB compressed TIFF, 65,000 files Scanned topographic maps 100% U.S. coverage 1:24,000, 1:100,000 and 1:250,000 scale maps Maps vary in age USGS Image Data
User Interface Concept • Display Imagery: • 316 m 200 x 200 pixel images • 7 level image pyramid • Resolution 1 meter/pixel to 64 meter/pixel • Navigation Tools: • 1.5 m place names • “Click-on” Coverage map • Longitude and Latitude search • U.S. Address Search • External Geo-Spatial Links to: • USGS On-line Stream Gauges • Home Advisor Demographics • Home Advisor Real Estate • Encarta Articles • Steam flow gauges Concept: User navigates an ‘almost seamless’ image of earth Click on image to zoom in Buttons to pan NW, N, NE, W, E, SW, S, SE Links to switch between Topo, Imagery, and Relief data Links to Print, Download and view meta-data information
Terra Service New Things • A popular web service • Exactly the map you want. • Dynamic Map Re-projection • UTM to Geographic projection • Dynamic texture mapping? • New Data • 1 foot resolution natural color imagery • Census Tiger data • Lights Out Management • MOM • Auto-backup / restore on drive failure
New “Urban Area” Data Microsoft Campus at 4 meter resolution “Redundant Bunch 1” Ball field at .25 meter resolution
TerraServer Becomes a Web ServiceTerraServer.net -> TerraService.Net • Web server is for people. • Web Service is for programs • The end of screen scraping • No faking a URL: pass real parameters. • No parsing the answer: data formatted into your address space. • Hundreds of users but a specific example: • US Department of Agriculture
Get image meta-data Query TS Gazetteer Retrieve TS ImageTiles Projection conversions Web Map Client OpenGIS “like” Landmarks layered on TerraServer imagery Geo-coded data of well-known objects (points), e.g. Schools, Golf Courses, Hospitals, etc. Polygons of well-known objects (shapes), e.g. Zip Codes, Cities, etc Fat Map Client Visual Basic / C# Windows Form Access Web Services for all data TerraServer Web Services Terra-Tile-Service Landmark-Service Sample Apps http://terraservice.net
Web Services Your program Web Server http • Web SERVER: • Given a url + parameters • Returns a web page (often dynamic) • Web SERVICE: • Given a XML document (soap msg) • Returns an XML document • Tools make this look like an RPC. • F(x,y,z) returns (u, v, w) • Distributed objects for the web. • + naming, discovery, security,.. • Internet-scale distributed computing Web page Your program Web Service soap Data In your address space objectin xml
Terraserver Architecture HTML DB Server Map UI Web Forms Standard Browsers Image/jpeg 668 m Rows Map Server Http Handler Smart Clients SQL 20002.0 TB Db TerraServer Web Service Image/jpeg WindowsForms SQL 20002.0 TB Db XML .NET Framework SQL 20002.0 TB Db ADO.NET OLEDB
External Group Image Source Search Job Search Dest AltCountry CountryName External Link SourceMeta Scale Job Search Job Log AltState State Name External Geo ImageMeta Load Job JobQueue Place Name AltPlace Image Search Imagery JobSystem Media FeatureType Small PlaceName Famous Category Image Type TerraServer MediaFile Pyramid Famous Place NoImage Terra Database Gazetteer Imagery Search Admin LoadMgmt TerraServer Schema
Internet Data Center Remote Management Terminal Server SQL Server SQL Server SQL Server Active Server Pages Loading Scheduling System StoredProcs StoredProcs StoredProcs Bricks Fire Wire disks Load Process 2 TBDatabase 2 TBDatabase 2 TBDatabase Read 4 Images Write 1 TerraScale CorporateNetwork 6 TB Staging Area TerraCutter ReadImageFiles
KVM / IP TerraServer Hardware • Storage Bricks • “White-box commodity servers” • 4tb raw / 2TB Raid1 SATA storage • Dual Hyper-threaded Xeon 2.4ghz, 4GB RAM • Partitioned Databases (PACS – partitioned array) • 3 Storage Bricks = 1 TerraServer data • Data partitioned across 20 databases • More data & partitions coming • Low Cost Availability • 4 copies of the data • RAID1 SATA Mirroring • 2 redundant “Bunches” • Spare brick to repair failed brick 2N+1 design • Web Application “bunch aware” • Load balances between redundant databases • Fails over to surviving database on failure • ~100K$ capital expense.
Public: Access to remote sensing data with no GIS expertise required Ubiquitous: No special hw/sw required by client Delivery: All OnLine/Internet Based, no tape or CD distribution Simple: Designed to be used by a “6th grade geography student” Test/show scalability Test/show availability: Test/show lights out: all operations & maintenance occurs remotely Minimal ops and dev staff “web service” poster child Research Objectives User/App Goals Technology Goals
Virtual Observatoryhttp://www.astro.caltech.edu/nvoconf/http://www.voforum.org/ • Premise: Most data is (or could be online) • So, the Internet is the world’s best telescope: • It has data on every part of the sky • In every measured spectral band: optical, x-ray, radio.. • As deep as the best instruments (2 years ago). • It is up when you are up.The “seeing” is always great (no working at night, no clouds no moons no..). • It’s a smart telescope: links objects and data to literature on them.
ROSAT ~keV DSS Optical IRAS 25m 2MASS 2m GB 6cm WENSS 92cm NVSS 20cm IRAS 100m Why Astronomy Data? • It has no commercial value • No privacy concerns • Can freely share results with others • Great for experimenting with algorithms • It is real and well documented • High-dimensional data (with confidence intervals) • Spatial data • Temporal data • Many different instruments from many different places and many different times • Federation is a goal • The questions are interesting • How did the universe form? • There is a lot of it (petabytes)
Time and Spectral DimensionsThe Multiwavelength Crab Nebulae Crab star 1053 AD X-ray, optical, infrared, and radio views of the nearby Crab Nebula, which is now in a state of chaotic expansion after a supernova explosion first sighted in 1054 A.D. by Chinese Astronomers. Slide courtesy of Robert Brunner @ CalTech.
SkyServer.SDSS.org • A modern archive • Raw Pixel data lives in file servers • Catalog data (derived objects) lives in Database • Online query to any and all • Also used for education • 150 hours of online Astronomy • Implicitly teaches data analysis • Interesting things • Spatial data search • Client query interface via Java Applet • Query interface via Emacs • Popular -- 1% of Terraserver • Cloned by other surveys (a template design) • Web services are core of it.
Demo of SkyServer • Shows standard web server • Pixel/image data • Point and click • Explore one object • Explore sets of objects (data mining)
Data Federations of Web Services • Massive datasets live near their owners: • Near the instrument’s software pipeline • Near the applications • Near data knowledge and curation • Super Computer centers become Super Data Centers • Each Archive publishes a web service • Schema: documents the data • Methods on objects (queries) • Scientists get “personalized” extracts • Uniform access to multiple Archives • A common global schema Federation
Federation: SkyQuery.Net • Combine 4 archives initially • Just added 10 more • Send query to portal, portal joins data from archives. • Problem: want to do multi-step data analysis (not just single query). • Solution: Allow personal databases on portal • Problem: some queries are monsters • Solution: “batch schedule” on portal server, Deposits answer in personal database.
Each SkyNode publishes Schema Web Service Database Web Service Portal is Plans Query (2 phase) Integrates answers Is itself a web service ImageCutout SkyQuery Portal 2MASS INT SDSS FIRST SkyQuery Structure
SkyQuery: http://skyquery.net/ • Distributed Query tool using a set of web services • Four astronomy archives from Pasadena, Chicago, Baltimore, Cambridge (England). • Feasibility study, built in 6 weeks • Tanu Malik (JHU CS grad student) • Tamas Budavari (JHU astro postdoc) • With help from Szalay, Thakar, Gray • Implemented in C# and .NET • Allows queries like: SELECT o.objId, o.r, o.type, t.objId FROM SDSS:PhotoPrimary o, TWOMASS:PhotoPrimary t WHERE XMATCH(o,t)<3.5 AND AREA(181.3,-0.76,6.5) AND o.type=3 and (o.I - t.m_j)>2
SkyNode Basic Web Services • Metadata information about resources • Waveband • Sky coverage • Translation of names to universal dictionary (UCD) • Simple search patterns on the resources • Cone Search • Image mosaic • Unit conversions • Simple filtering, counting, histogramming • On-the-fly recalibrations
Portals: Higher Level Services • Built on Atomic Services • Perform more complex tasks • Examples • Automated resource discovery • Cross-identifications • Photometric redshifts • Outlier detections • Visualization facilities • Goal: • Build custom portals in days from existing building blocks (like today in IRAF or IDL)
Let users add personal DB 1GB for now. Use it as a workbook. Online and batch queries. Moves analysis to the data Users can cooperate (share MyDB) Still exploring this ImageCutout SkyQuery Portal 2MASS INT SDSS FIRST MyDB added to SkyQuery MyDB
The Big Picture Experiments & Instruments facts • Data ingest • Managing a petabyte • Common schema • How to organize it? • How to reorganize it • How to coexist with others questions facts ? Other Archives facts answers Literature facts Simulations The Big Problems • Query and Vis tools • Support/training • Performance • Execute queries in a minute • Batch query scheduling
Grid and Web Services Synergy • I believe the Grid will be many web services share data (computrons are free) • IETF standards Provide • Naming • Authorization / Security / Privacy • Distributed Objects Discovery, Definition, Invocation, Object Model • Higher level services: workflow, transactions, DB,.. • Synergy: commercial Internet & Grid tools