Download
1 / 29
330 likes | 617 Views
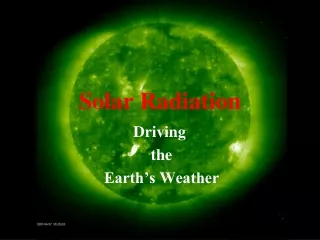
Solar Radiation. Sun-Earth relationships Array Orientation Solar Radiation Data Sheets. US Energy Consumption. A false color image of the sun enhances the turbulent nature of the sun’s photosphere, including a roiling surface, sunspots, and giant flares.

E N D
Solar Radiation Sun-Earth relationships Array Orientation Solar Radiation Data Sheets
US Energy Consumption A false color image of the sun enhances the turbulent nature of the sun’s photosphere, including a roiling surface, sunspots, and giant flares.
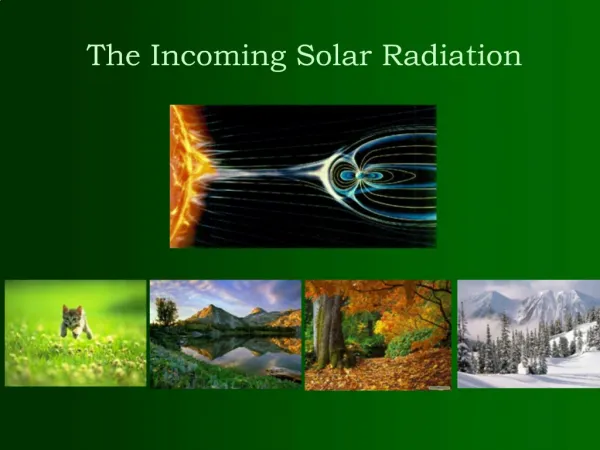
Even over the vast distance, an enormous amount of energy reaches Earth from the sun. Distance from Sun to Earth
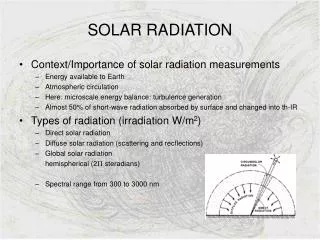
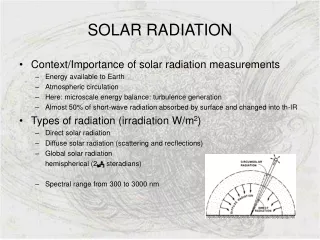
Harnessing the Sun Solar irradiance is solar radiation power per unit area.
The inverse square law states that radiation energy is reduced in proportion to the inverse square of the distance from the source. Inverse Square Law
Solar Irradiation Solar irradiation equals to solar irradiance over time.
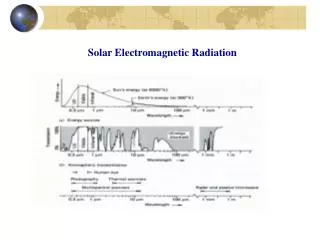
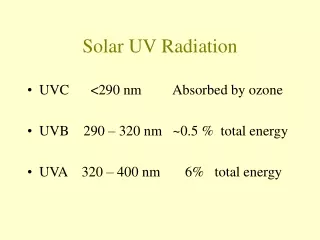
The electromagnetic spectrum is composed of electromagnetic radiation with varying with wavelengths. Electromagnetic Spectrum
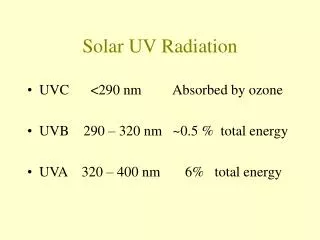
Solar Spectrum The wavelength distribution of the sun from UV to infrared reaching earth.
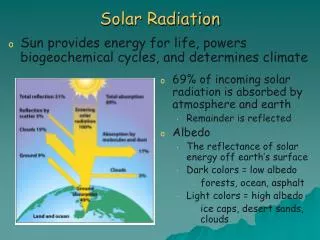
Atmospheric Effects Solar radiation entering Earth’s atmosphere becomes direct, diffuse, or albedo radiation.
Air mass is a representation of the amount of atmosphere radiation that must pass through to reach Earth’s surface. Air Mass
Peak Sun Hours Peak sun hours is an equivalent measure of total solar irradiation in a day.
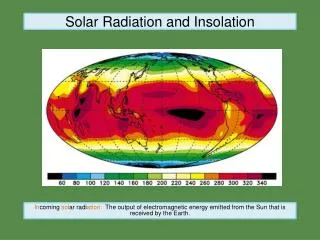
Insolation maps rate locations by their average daily peak sun hours. Average Annual Isolation Map
The atmosphere absorbs extraterrestrial radiation at certain wavelengths, resulting in an altered spectral distribution for terrestrial radiation. Terrestrial Solar Spectrum
PV devices are designed to respond to the wavelengths corresponding to the greatest amount of solar energy. Spectral PV Device Response
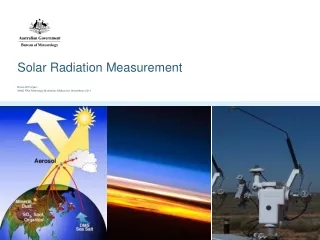
A pyranometer measures total solar irradiance from the whole sky. Pyranometers
Handheld pyranometers use less precise sensors than precision pyranometers but are more suitable for field measurements. Some use separate sensors that are connected to a meter, while some have the sensor and meter integrated in one unit. Handheld Pyranometers
A pyrheliometer measures the direct component of solar irradiance, which is important when installing concentrating collectors. Pyrheliometers
Reference cells output a certain electrical current for each unit of solar irradiance received. Reference Cells
The ecliptic plane is formed by Earth’s elliptical orbit around the sun. Earth’s Orbit Around the Sun
Solar Declination The equatorial plane is tipped 23.5° from the ecliptic plane. Over a year, this orientation produces a varying solar declination.
Solstices The summer solstice occurs when the Northern Hemisphere is tipped towards the sun. The winter solstice occurs when the Northern Hemisphere is tipped away from the sun.
The fall and spring equinoxes occur when the sun is directly in line with the equator. Equinoxes
Solar Azimuth and Altitude Angles Solar azimuth and altitude angles are used to describe the sun’s location in the sky.
Sun Paths The sun’s path across the sky at various times of the year can be illustrated on a diagram. The diagrams change for different latitudes.
Solar Window The solar window is the area of sky containing all possible locations of the sun throughout the year for a particular location.
Array Orientation Array orientation can be described using azimuth and tilt angles.
Optimum Array Tilt Angles Energy production at certain times of the year can be optimized by adjusting the array tilt angle.
Seasonal Declination The average seasonal declinations define the optimal tilt angles for those periods.
NREL Solar Radiation Data The National Renewable Energy Laboratory (NREL) provides solar radiation data for various locations, times of the year, and array orientations for use in planning PV installations.