Improving Solar Radiation Forecasting
Improving Solar Radiation Forecasting. Betsy Weatherhead, U. Colorado Craig S. Long, NOAA/NWS/NCEP/CPC Kathy Lantz, U. Colorado Patrick Disterhoft, U. Colorado. AMS Summer Meeting, August 12, 2009. Needs of Renewable Energy Community.

Improving Solar Radiation Forecasting
E N D
Presentation Transcript
Improving Solar Radiation Forecasting Betsy Weatherhead, U. Colorado Craig S. Long, NOAA/NWS/NCEP/CPC Kathy Lantz, U. Colorado Patrick Disterhoft, U. Colorado AMS Summer Meeting, August 12, 2009
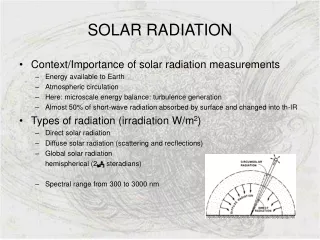
Needs of Renewable Energy Community • Solar radiation can reduce the demand on the grid (personal Photo-voltaic panels). Highly angle dependent. Total Solar Radiation. • PV plants depend on total solar radiation. • Fixed angle • Single axis • Full rotation • Concentrated Solar Energy highly dependent on direct beam radiation • Various forms of energy storage • Time scales from seconds to decades with a strong focus on minutes to days.
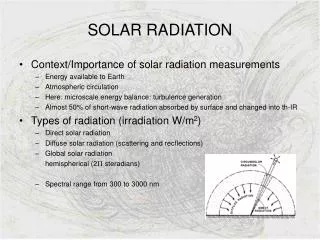
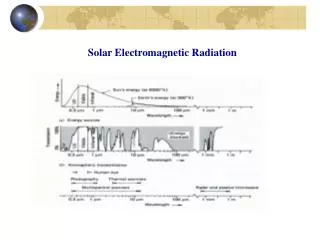
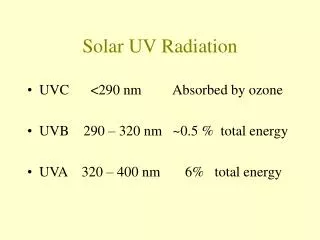
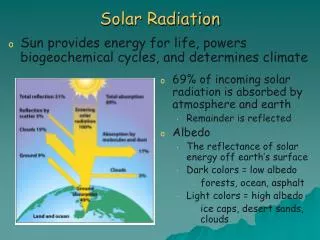
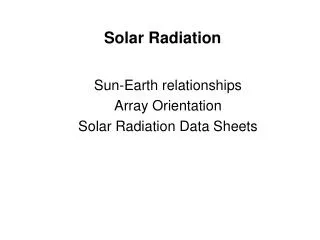
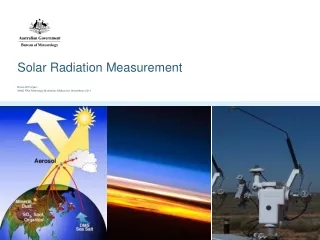
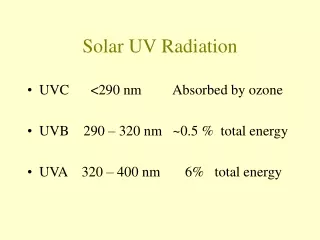
Solar Radiation - Basics • Solar radiation reaching the surface of the Earth is affected by many factors: • Sun angle • Clouds • Aerosols • Surface reflectivity • Water vapor • Ozone • All of these factors can change dynamically on a day-to-day basis. • Each part of the solar spectrum is affected differently by these factors.
Technologies are still developing • Wavelength matters. • Clouds, aerosols, ozone, water vapor all matter.
Multiple paths to making solar forecasts • Proprietary • Data extrapolation • Statistical modeling • Physical modeling • Ensemble forecasts • Data assimilation, rapid refresh
Forecast NOAA’s NWS Model Production Suite Oceans HYCOM WaveWatch III Climate CFS Coupled Hurricane GFDL HWRF MOM3 ~2B Obs/Day Mostly Satellite +Radar Dispersion ARL’s HYSPLIT North American Mesoscale WRF NMM Global Forecast System Global Data Assimilation Severe Weather WRF NMM WRF ARW North American Ensemble Forecast System Short-Range Ensemble Forecast WRF: NMM+ARW ETA, RSM Air Quality GFS, Canadian Global Model NAM+CMAQ Rapid Update for Aviation, Severe Weather Courtesy Stan Benjamin NOAH Land Surface Model
Forecasting Solar UV Radiation • UV Forecasts have taken place for fifteen years in support of human health. • NOAA, various weather services, Accu-Weather • Private monitoring offers Nowcasts.
UV Index Algorithm • Old (virtually unchanged since 1994) • Weight UV relationship w/total ozone and SZA derived from delta Eddington RT model. • Total ozone fcsts from GFS. • Surface UV albedo held constant at 5%,(no allocation for snow or ice cover). • Aerosols: AOD is constant at 0.2 and SSA = 1.0. • Elevation increases UV flux by ~6% per km. • UVI clear sky field on 1x1 grid up to this point. • Relationship between NGM MOS cloud prob and cloud attenuation of UV flux. • Cloudy UV Index values at all (~800) MOS locations. • Bulletin, Eta grid 211 and 207 are created by interpolation from MOS cities. • Products are limited to next day solar noon over US. • New • Weight UV relationship with total ozone, and SZA derived from NCAR-TUV RT model. • Total ozone fcsts from GFS. • Surface UV albedo held constant at 3% for non-snow conditions. • GFS albedo is used when > 30% (where snow is possible). • Aerosols: AOD and SSA vary, derived from seasonal global climatology grids. • Elevation increases UV flux by ~ 6% per km. • Ratio of GFS down-welling UVB flux w & w/o clouds determines cloud attenuation. • Output remains on gaussian grid. • GFS inputs available at 3hr interval. • UV Index products are outputted globally at 1 hr intervals out to 96 hours
UV Index : 0 1 2 3 4 5 6 7 8 9 10 11 12 13 14 15
40.04N, 88.36W 25 mWatts/sq m = 1 UV Index unit Erythemal Dose Rate (mW/sq m) __ Diurnal trace of observed UV x 1 hour mean about 18 UTC | St Dev of obs +/- 0.5 hr about 18 UTC o 18 hr FCST from 00Z run valid at 18 UTC
Improvements in NWS’ solar UV forecast • Improvements in cloud and ozone forecasts result in a much improved solar forecast. • Verification depends strongly on time period of averaging when single locations are considered.
Significant improvements in solar radiation forecasts • Cloud modeling has improved significantly over the past twenty years. • Inclusion of “cloud optical depth” and “cloud height” are of considerable importance to assessing transmission. • Aerosol forecasts are currently under consideration in NWS.
1 Day Forecast Verification 25 mWatts/sq m = 1 UV Index unit
Fine temporal structure is extremely difficult. 25 mWatts/sq m = 1 UV Index unit 278 DU 309 DU
Renewable Energy Needs • Improved forecasts are necessary for optimal use of solar energy integration. • Multiple factors must be considered to make accurate forecasts: clouds, aerosols, water vapor. • NWS currently makes solar radiation forecasts for 57 locations for UV index. Significant improvements have been achieved using state of the art cloud forecasting. • Fundamentally, improvements require accurate measurements of both direct and diffuse radiation.
Long-term Predictions Long-term estimates of solar radiation will need to take into multi-year factors including el nino, solar cycles, NAO, changes in climate, including in changes in the jet stream. Predictions of long-term changes will require research into past long-term datasets as well as best available climate models. Actual hourly variation of solar energy potential - accurate forecasts are essential
Foundation for Model Improvement--Measurements • Surface Radiation monitoring • Direct beam separate from total solar radiation. • DOE’s Atmospheric Radiation Measurement, National Renewable Energy Laboratory • NOAA’s SurfRad, Central Calibration Facility • USDA’s UV Monitoring Network • Direct beam measurements are difficult, but not impossible. NOAA’s SurfRad Network
Summary • Data are the foundation for improving forecasts. • Current solar monitoring is inadequate, but can be easily adapted and expanded. • Multiple modeling approaches will be needed to address the multiple needs of the renewable energy communities.